Environmental Engineering Reference
In-Depth Information
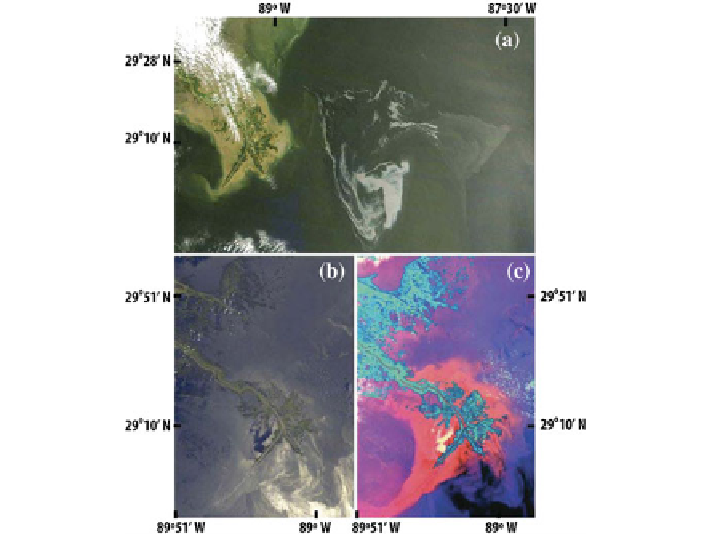
Fig. 1.3 a
Oil slick as seen in a Terra MODIS visible-near IR image, distinguishable because of its
a pale swirl in the darker seawater of the Gulf of Mexico just south of the Mississippi Delta on May
1, 2010;
b
MISR true colour image for May 17, 2010;
c
MISR multi-angle composite acquired on
the same date that separates the oil spill (
black
and
dark blue
) from specular reflections
the sunglint pattern of the near-noon collections or outside (Fig.
1.3
a). Oil at the sea
surface can have a higher or lower reflectance than the surrounding seawater across
the visible and near IR bands [
8
,
10
]. As a result, these images were used to measure
the surface area and edges of the spill and the direction of flow over time. The capa-
bilities of MISR enhanced the difference in brightness by reducing sun glint, and the
use of textural classifiers increased mapping accuracy by using single images. The
MISR images (Fig.
1.3
b, c) demonstrated how far the oil had dispersed on the sea
surface around the Mississippi Delta. The MISR combines images taken at different
angles into a single computerized colour image that distinguishes surface oil from
seawater and silt. Oil is shown in black and dark blue colours, while silt from the
Mississippi is shown as red, orange, and pink colours. Because oil has a different
thermal inertia than seawater, multi-temporal thermal data from satellite sensors,
such as MODIS or ASTER, were examined and used to further reduce the error in
oil slick identification. Interpretations of these image types were verified by imagery
derived from SAR images and from overflights.
The operational preparation of the MPSRs involved satellite imagery as well as
ancillary data such as surface currents and winds. The different sources of radar and
Search WWH ::

Custom Search