Biology Reference
In-Depth Information
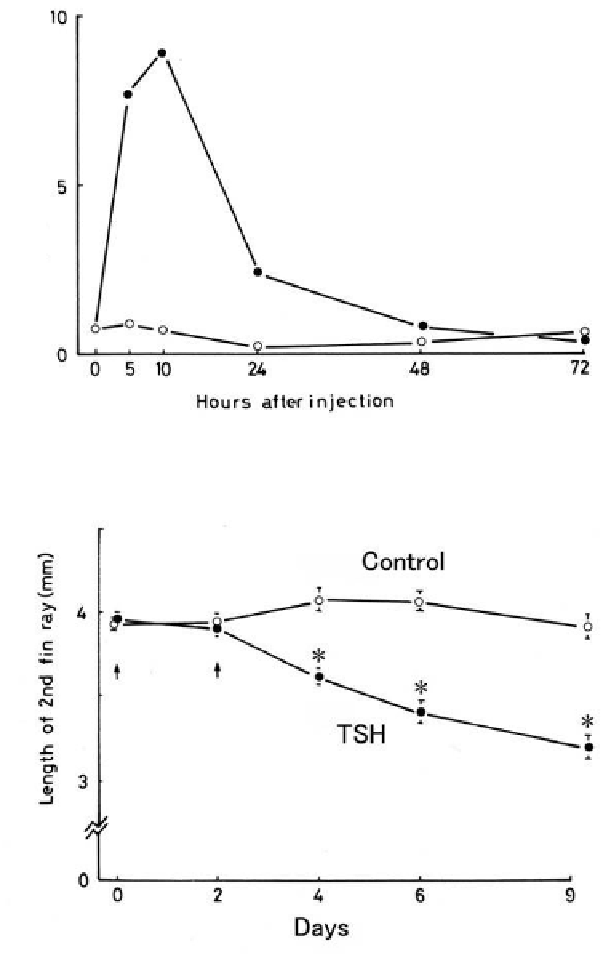
Hours after injection
Figure 6.
Changes in tissue T4 levels of Japanese fl ounder larvae after a single injection of
bovine TSH at a dose of 5 mIU/g (closed circles). Open circles indicate the levels of the saline-
injected control fi sh. [From Inui et al., 1989, with permission].
Figure 7.
Effect of bovine TSH on the length of second fi n ray of Japanese fl ounder larvae.
Bovine TSH (5 mIU/g) was injected on day 0 and 2 as indicated by arrows. Signifi cantly
different (P<0.001) from the level of the respective saline-injected control for the given time
period by t-test. [From Inui et al., 1989, with permission].