Geoscience Reference
In-Depth Information
20
18
16
14
12
10
8
6
US
4
2
Chicago
0
19001910192019301940195019601970198019902000201020202030
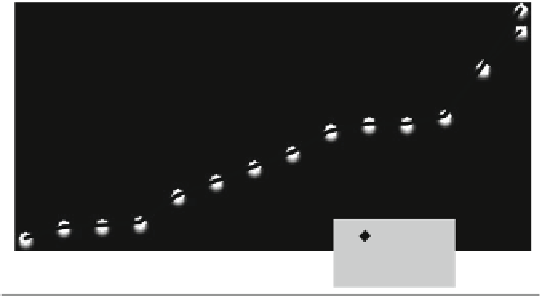
Fig. 11.2
Percentage of the population age 65 and over in the US and Chicago, 1900-2030
11 % in 2008 to an estimated 23 % in 2030. Dealing with this reality presents a
unique challenge for the government, as the welfare programs typically used to
alleviate socio-economic problems—such as public pension payments, medical
insurance benefits, and public assistance for the low-income classes—are in need
of rapid expansion, and yet tax revenue is on the decline (Chun
2006
).
Figure
11.3
reveals that there are likely to be significant changes in the con-
sumption volume (and composition of goods and services) by age groups between
2003 and 2030. Essentially, the lower age groups will have flat or declining growth
with much more rapid growth forecast for the upper age groups.
One of the major issues to be addressed is the degree to which it is analytically
important to estimate consumption by age group or income quintile; in this sense,
the analysis takes the next step from the Wakabayashi and Hewings (
2007
) analysis
by incorporating disaggregated consumption functions into an impact and
forecasting model by integrating an Almost Ideal Demand System (AIDS), pro-
posed by Deaton and Muellbauer (
1980
), into an econometric input-output model.
In this way, it is possible to explore the importance of household consumption
disaggregation in contrast
to results generated with a single representative
household.
11.2.1 The Modified Almost Ideal Demand System
2
The AIDS system is derived from the PIGLOG (price-independent log)-class
expenditure function defined as follows.
2
This section draws on Wakabayashi and Hewings (
2007
).