Geoscience Reference
In-Depth Information
Thousands
150
100
50
0
-50
-100
-150
1960
1970
1980
1990
2000
2010
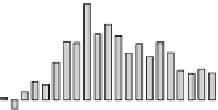
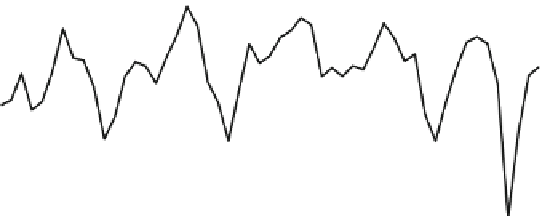
Employment Change
Net Migration
Fig. 8.1
Washington employment change and net migration
Table 8.6
Washington and U.S. employment and population growth rates (average annual
percent change)
Employment growth* Population growth
Washington U.S. Difference Washington U.S. Difference
1960-1970 3.3 2.8 0.5 1.9 1.3 0.6
1970-1980 3.5 2.5 1.0 2.0 1.1 0.9
1980-1990 2.7 1.9 0.8 1.7 1.0 0.7
1990-2000 2.6 1.8 0.8 1.9 1.3 0.6
2000-2010 0.6 0.2 0.4 1.3 0.9 0.4
1960-2010 2.5 1.8 0.7 1.7 1.1 0.6
Note
: The wage and salary employment growth rates are calculated 1 year earlier (e.g., 1959-1969
and 1969-1979)
Source
: Washington projection and simulation model data base
2 years. This indicates that, while people may offer all sorts of non-economic
reasons (social, political, and environmental) for moving, they tend to follow jobs.
5
The relationship between employment growth and net migration is strong
enough to be predictable by a simple rule of thumb, as demonstrated in Table
8.6
.
5
The population equation in the Puget Sound Forecasting Model (Conway
2001
,
2012
), a
structural time-series model, predicts the growth rate of regional population relative to the national
rate based on the relative growth rate of regional employment. All variables in the model are
expressed as the change in the natural log (a measure of each variable's growth rate). The
relationship between population change and employment change is described by an eight-quarter
polynomial distributed lag. The population forecasting equation, which also contains an ARMA
term, has a good track record—a 0.2 % average absolute error for the 19 one-year-ahead
predictions made in the fourth quarter of each year since 1993 (Conway
2013a
)—because the
principal explanatory variables (Puget Sound and U.S. employment) are lagged variables and thus
known when making one-year-ahead forecasts.