Biomedical Engineering Reference
In-Depth Information
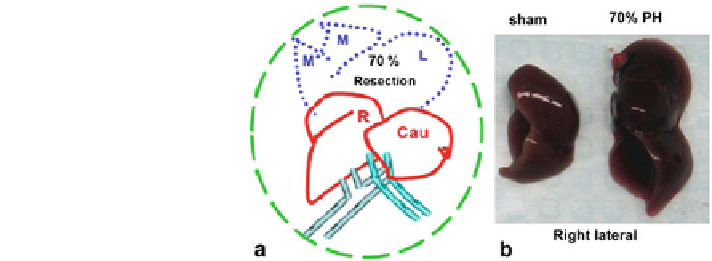
Fig. 3 Liver Hepatectomy.
a Schematic diagram of
partial hepatectomy model in
mouse. b Picture of sham and
70 % partial hepatectomy
(PH)
receptors, VEGFR2 or VEGFR3, also modulate liver SEC function. Using
VEGFR2-GFP mice in which the expression of green fluorescent protein (GFP) is
driven by the native promoter of VEGFR2, we have demonstrated that VEGFR2
and VEGFR3 are exclusively expressed in the liver endothelial cells but not in
other liver cell types, including hepatocyte nuclear factor 4a (HNF4A)
+
hepato-
cytes (Fig.
4
a). As shown in Fig.
4
b, the distribution of VEGFR3 expression is
restricted to VEGFR2
+
LSECs that branch out from CD34
+
VEGFR3
-
large
vessels.
5.1 Flow Cytometry Analysis
Flow cytometric analysis on non-parenchymal cells demonstrates the expression of
endothelial-specific marker VE-cadherin on non-hematopoietic VEGFR3
+
VEG-
FR2
+
CD45
-
LSECs, 97.6 % of which are non-lymphatic endothelial cells
expressing coagulation factor VIII (Fig.
5
a, b). We have designated a unique
phenotypic and operational signature for LSECs and other cells of adult mice as
shown in Table
2
. Identification of LSECs as VEGFR3
+
CD34
-
and non-sinusoidal
endothelial cells such as VEGFR3
-
CD34
+
is sufficient for quantification, purifi-
cation, and molecular profiling of LSECs.
In order to determine the mechanism by which LSECs regulate hepatic pro-
liferation, we examined the regenerative kinetics of hepatocytes and LSECs after
partial hepatectomy. Two days after partial hepatectomy, staining with VE-cad-
herin, hepatocyte marker epithelial (E)-cadherin, and mitotic marker phosphory-
lated-histone-3 (P-H3) revealed that P-H3
+
E-cadherin
+
mitotic hepatocytes were
positioned in the proximity of non-proliferating LSECs (Fig.
5
c).
Proliferation of LSECs starts at day 4 and plateaus by day 8 after PH (Fig.
6
a). In
comparison, quantification of P-H3
+
HNF4A
+
hepatocytes showed that the rate of
hepatocyte proliferation peaks during the first four days, leveling off by day 8 (Fig.
6
b).
The roles of the inductive signals in liver regeneration is schematized (Fig.
6
c).
Search WWH ::

Custom Search