Agriculture Reference
In-Depth Information
0.9
0.9
2004
2002
0.7
0.7
0.5
0.5
0.3
0.3
0.1
0.1
0.1
0.3
0.5
0.7
0.9
0.1
0.3
0.5
0.7
0.9
distance in km
distance in km
N
0.9
2006
14
0.7
12
E
10
0.5
yield
in t / ha
8
0.3
6
0.1
4
0.1
0.3
0.5
0.7
0.9
distance in km
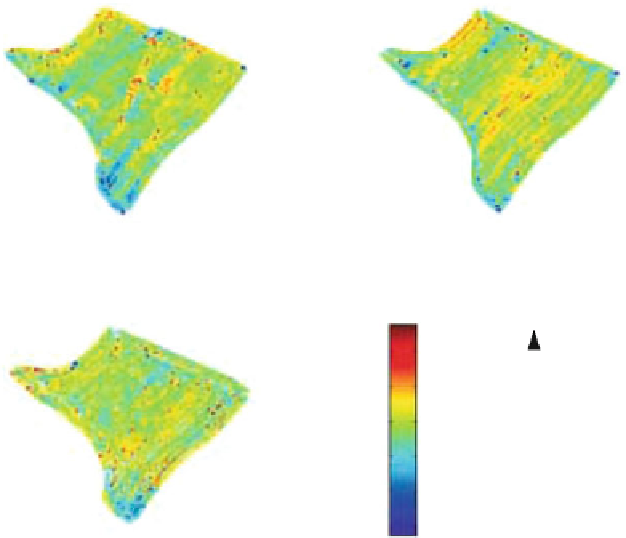
Fig. 13.4
Site-specifi c yield maps for winter-wheat on a fi eld with clay soils in Flawborough,
Nottinghamshire, England (From Milne et al.
2012
)
similarities between the years are evident. However, a close visual observation
reveals also many differences in the site-specifi c yields between the years. The coef-
fi cients of determination (r
2
) of the harvesting results for the site-specifi c cells
between the years were extremely low (Milne et al.
2012
):
•
between the year 2002 and the year 2004
r
2
= 0.07
•
between the year 2002 and the year 2006
r
2
= 0.03
•
between the year 2004 and the year 2006
r
2
= 0.03.
It may be surprising that despite the infl uence of the temporally constant soil
properties such as texture, organic matter and topography, any correlations in the
site-specifi c yields between the years practically do not exist. The explanation
for this is that these soil properties exert its infl uence on the growth of crops
always together with the weather. It is the
interaction
between soil properties
and the weather that creates the conditions for the growth of crops in rainfed
areas. In a wet year, the best growth is obtained in a soil that drains freely.
Vice
versa
in a dry year, the soil with the best water-holding capacity excels. So the
weather steadily alters the soil qualities for crop growth. And the infl uence of the