Agriculture Reference
In-Depth Information
chlorophyll
phenols
chlorophyll
0
chlorophyll
phenols
0
300
400
500
600
700
800
wavelength in nm
ultraviolet
blue
green
red
near-infrared
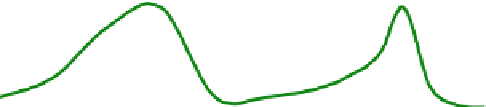
Fig. 11.4
Schematic diagram of plant fl uorescence: The light absorption in the ultraviolet region
by phenols (
violet line at top
) induces fl uorescence in the blue-green (
blue line at bottom
), the light
absorption in the blue and red region by chlorophyll (
green line at top
) induces fl uorescence in the
far-red region (
red line at bottom
)
In higher plants, the natural fl uorophores are mainly chlorophyll and phenols.
The latter are organic compounds that develop in plants during decomposition. The
chlorophyll absorbes primarily in the blue as well as in the red and it emits fl uores-
cence in the far red, whereas the phenols absorb dominantly in the ultraviolet and
emit in the blue and green. The typical spectral characteristics of these optical prop-
erties are shown in Fig.
11.4
.
A non-invasive measurement is only possible from the whole leaf or plant. This
is of course not only a fl uorescent dilution, but it is a very complex optical system
with many other compounds in separated compartments and with a typical geo-
metrical structure. For a fi rst approach, one can summarise up to three types of fl uo-
rescence with their related measurement techniques:
• With excitation in the ultraviolet, the whole fl uorescence
emission spectrum
is possible to measure. The excitation wavelength, which is also refl ected, can
be separated from the emission with wavelength-selective fi lters. But with
blue or red excitation, only the chlorophyll fl uorescence is measureable.
Because these wavelengths are not short enough to induce phenolic fl uores-
cence. So the fl uorescence emission provides information about chlorophyll
and/or phenols.
• Another method is measuring the
excitation spectra
,
which induce the fl uores-
cence
.
The excitation wavelength is changed consecutively to discrete bands or
scanned continuously and the fl uorescence is measured at a fi xed emission wave-
length. So a kind of absorption spectrum for substances inside the leaf is obtained.
Normally the emission is detected in the far red (approximately 650-750 nm). So
chlorophyll serves as sensor inside the leaf. Mainly two excitations are used: one
within the ultraviolet and one within the visible region.
• As mentioned before in Sect.
6.4
“Fluorescence Sensing”, the fl uorescence is
also temporally variable. This so called “
Kautsky effect
” is typically measured