Agriculture Reference
In-Depth Information
Table 10.2
Automatic classifi cation of plant species in winter wheat (Triticum aestivum) using
digital image analysis (data of 2,100 images) (Sökefeld et al.
2007
)
Identifi cation in % (identifi cation fi gures in horizontal lines add up to 100 %)
Mayweed
(Matricaria
chamonilla)
Wheat
(Tritic. aest.)
Grass
weeds
Catchweed
(Galium aparine)
Other
broad-leafs Sum
Wheat
80
13
7
0
0
100
Grass weeds
0
100
0
0
0
100
Catchweed
0
0
92
0
8
100
Mayweed
0
0
0
100
0
100
Other broadleafs
0
0
20
0
80
100
Total
86
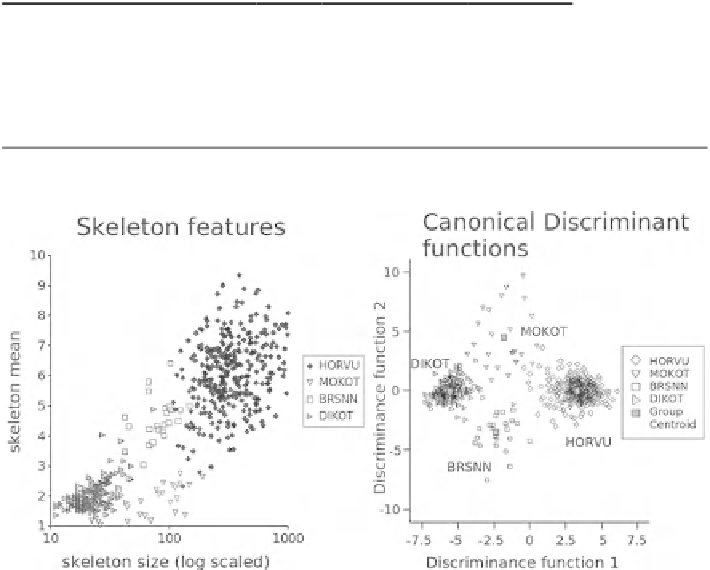
Fig. 10.9
(
left
) Two dimensions of the feature space: skeleton mean and size; (
right
) the fi rst two
discriminant functions. The classes are:
HORVU
Hordeum vulgare,
MOKOT
grass
weeds,
BRSNN
Brassica napus,
DIKOT
broad-leaved weeds (Weis and Gerhards
2007
)
maize, sugar beet, rape-seed and peas. No problems with the camera technology
arose due to vibration of the fi eld vehicle, dust and moisture.
A different dataset was classifi ed including images of four plant species groups:
Winter barley (HORVU), grass-weeds (MOKOT), rape (
Brassica napus
BRSNN)
and other broadleafs (DIKOT). Plant species groups that were in different growth
stages are partly overlapped. This led to a high variation in the features (Fig.
10.9
).
Approximately 40 different
classifi ers
including Bayes functions, nearest neigh-
bor, classifi cation trees were applied to classify the dataset. All of them performed
better than 95 % (correct classifi cation rate) in a 10-fold cross validation. The main
result of this test was that the type of classifi er was less important than the selection
of the right features and grouping of plant species into meaningful classes.