Agriculture Reference
In-Depth Information
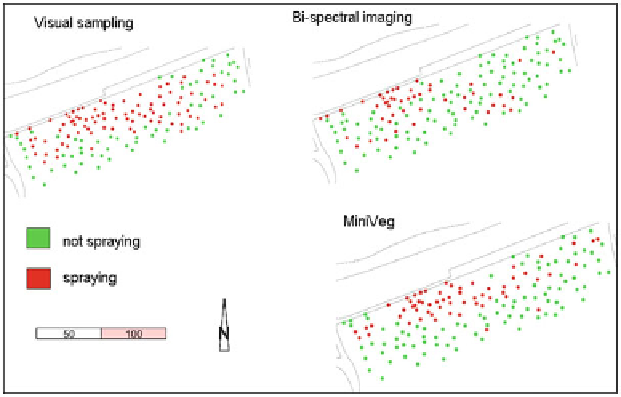
Fig. 10.3
Weed distribution maps derived from visual countings, bi-spectral imaging and
MiniVeg® measurements in a 5.6 ha fi eld at Ihinger Hof in winter wheat in autumn 2008. For
details to bi-spectral imaging see the next section (After Gerhards et al.
2012
)
10.2.3
Digital Image Analysis Based on Shape Features
10.2.3.1
The Sensing and Processing Concept
A very promising approach for weed detection and identifi cation is a continuous
ground-based detection method based on
image analysis
(Weis et al.
2008
). With
this method, weeds and crops are segmented from digital images in real-time using
a bi-spectral camera system connected to DGPS. Weed species as well as crops are
identifi ed and counted based on automatic classifi cation of
shape features
. The
entire system for site-specifi c weed control consists of three parts, which are sepa-
rated and can communicate via interfaces:
1. A bi-spectral camera system with practical suitability for the fi eld connected to
DGPS.
2. An image processing and classifi cation component including a weed/crop-
database used for the classifi cation.
3. A GPS-controlled patch sprayer.
First, laboratory studies were conduced to analyze refl ection properties of
green plants, different soils (organic, sandy, stony, wet, dry), stones and organic
mulch using a video spectrometer (Fig.
10.4
). The refl ectance of all objects men-
tioned above within the fi eld of view of the video spectrometer in the spectral
band between 338 and 925 nm was visualized using grey levels from 0 (black) to
255 (white).