Agriculture Reference
In-Depth Information
solar irradiance as reference
plant radiance incl. fluorescence
c
a
d
b
fluorescence
wavelength, no scale
wavelength, no scale
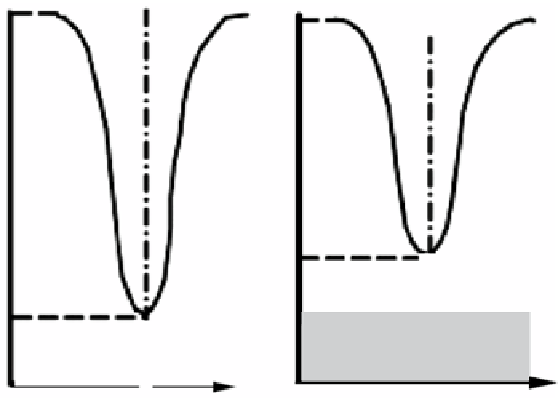
Fig. 6.14
Basics for passive sensing of the chlorophyll fluorescence of vegetation using Fraunhofer
lines. The radiance that is coming from the plants (
right
) is compared to the irradiance (
left
) that
hits an adjacent reference panel situated in the same illumination conditions. The radiations
denoted with the letters
a
,
b
,
c
and
d
are sensed. The components
a
and
c
are recorded adjacent to
the wavelength of the Fraunhofer line, whereas
b
and
d
are measured precisely in this line. It
should be noted that adding the components a and b or alternatively c and d does not make sense
since the wavelengths are different
In order to be useful, such a Fraunhofer line must be in a region where fluores-
cence recording makes sense. Within the red and far red range, such Fraunhofer
lines exist
•
at 656.3 nm wavelength due to absorption by hydrogen
•
at 687.0 nm wavelength due to absorption by oxygen and
•
at 760.0 nm wavelength again due to absorption by oxygen.
The 687 nm oxygen wavelength almost coincides with the red peak of the chlo-
rophyll fluorescence spectrum that is recommended for plant stress sensing
(Fig.
6.13
, top). However, at this wavelength as well as at the 656.3 nm hydrogen
wavelength, the absorption of solar radiation by the atmosphere is much less than at
the 760.0 nm oxygen wavelength. It is for this reason that generally the 760.0 nm
oxygen band is preferred (Liu et al.
2005
; Maier et al.
1999
; Moya et al.
2004
),
which still is rather near to the recommended band in the far-red range.
The basic measurements needed to detect sunlight-induced fluorescence in
Frauenhofer lines are outlined in a simplified way by letters in Fig.
6.14
. The left
inverted Gaussian curve indicates the band of
irradiance
that is directed towards
the canopy. The intensity of this irradiance decreases on its way through the atmo-
sphere as a result of absorption,
e.g.
by oxygen. The vertical Frauenhofer line rep-
resents the wavelength that is the center of the attenuation.