Agriculture Reference
In-Depth Information
50
chlorophyll mass per
unit leaf area constant
at 50 micrograms per cm
2
4
3
2
40
30
1
leaf area index
20
10
0
450
500
550
600
650
700
750
800 nm
40
leaf area index constant
at 2.5 m
2
per m
2
of soil
30
chlorophyll concentration in leaves
in micrograms per cm
2
20
20
4
60
80
10
0
450
500
550
600
650
700
750
800
wavelength in nm
blue
green
red
red edge
near-infrared
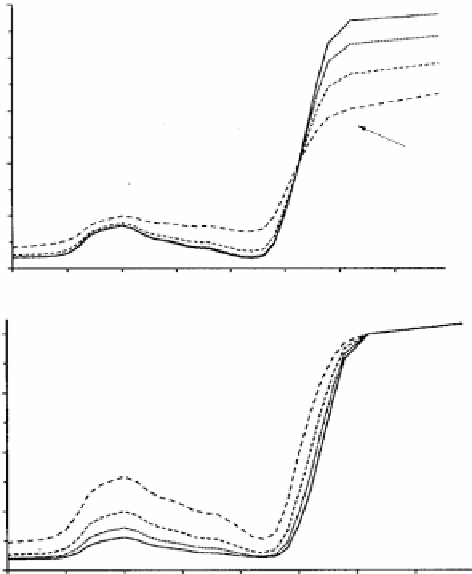
Fig. 6.3
Reflectance of plants depending on either the leaf-area-index (
top
) or on the chlorophyll
concentration in the leaves (
bottom
). The curves are based on simulation models. For the
top
graph
, the chlorophyll mass per unit leaf area is constant. Vice versa, for the
bottom graph
, the
leaf-area-index is constant (From Reusch
1997
, altered)
clearly with the leaf-area-index. In the visible region, more leaves generally result
in some decrease of reflectance because - even if the chlorophyll content within
single leaves is constant - this improves the absorbance. However, the effects of
either more leaves or of more chlorophyll within the leaves in the visible range are
not the same: more leaves mainly reduce the reflectance in the red part, whereas
more chlorophyll lowers it in the green region (Fig.
6.3
).
The visible and near-infrared reflectance from both sides of the red edge lends
itself for differentiating between soil and plants. Because within this range, the
reflectance for soil increases slowly and steadily, however, for vegetation or crops it
rises drastically (Fig.
6.2
).
Hence the relation between red and infrared reflectance can be used as an
indicator
of a vegetation cover
within a field (Fig.
6.4
). This holds despite the fact that in a
strict sense the reflectance of a bare soil within a field might not be constant as a