Agriculture Reference
In-Depth Information
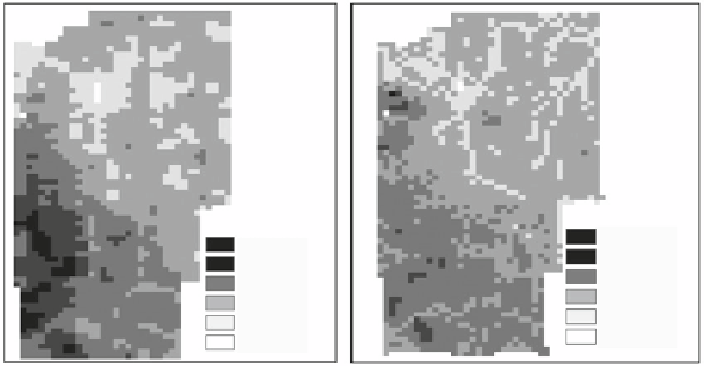
remote
sensing
from
satellite
proximal
sensing
from
vehicle
r
2
= 0.62
r
2
= 0.81
cell size:
15 m x15 m
cell size:
15 m x15 m
total C in %
total C in %
0.45 - 0.60
0.60 - 1.00
1.00 - 1.40
1.40 - 1.80
1.80 - 2.20
2.29 - 2.29
0.33 - 0.60
0.60 - 1.00
1.00 - 1.40
1.40 - 1.80
1.80 - 2.20
2.20 - 2.43
Fig. 5.27
Carbon maps obtained by reflectance sensing either from a land based vehicle or from
a satellite (From Huang et al.
2007
, altered)
the reflectance signals by stepwise multiple regression with principal component
analysis allowed to obtain the effects of various soil properties on the prediction of
carbon sensing. The processing included site-specific topographic signals that were
obtained via RTK-GPS (Sect.
5.1
).
For all properties or variables listed, it holds that their incorporation in the sens-
ing and processing improved the estimation of soil carbon (Table
5.5
). The most
important effect on the coefficient of determination (r
2
) as well as on the root mean
squared error had the topography (slope and inclination).
However, this topographical effect is - at least partly - an indirect one. Because
site-specific moisture and texture too depend on topography. And since topography
with present day technology is easy to sense and map, it should be the first choice
for improving the carbon sensing on a multiple property basis.
The carbon maps in Fig.
5.27
are based on such multiple soil property sensing.
However, besides carbon only topography was taken into account by the process-
ing program. So actually,
dual soil property sensing
with the aim of carbon
recording took place. The wavelength range for the proximal sensing in the left
map extended from 900 to 1,700 nm - as with the correlations in Table
5.5
. For
the remote sensing in the right map, the range went from 450 to 2,350 nm, how-
ever, with some interruptions in the infrared part due to transmission barriers
outside the atmospheric windows. Although generally longer wavelengths allow
for more precision, the results for remote sensing were less accurate than those for
proximal sensing. Its coefficient of determination (r
2
) - based on defined point
estimations - is lower. Explanations for this may be - among others - the inter-
ruptions caused outside the atmospheric windows and the much longer sensing
sensing look similar.