Biology Reference
In-Depth Information
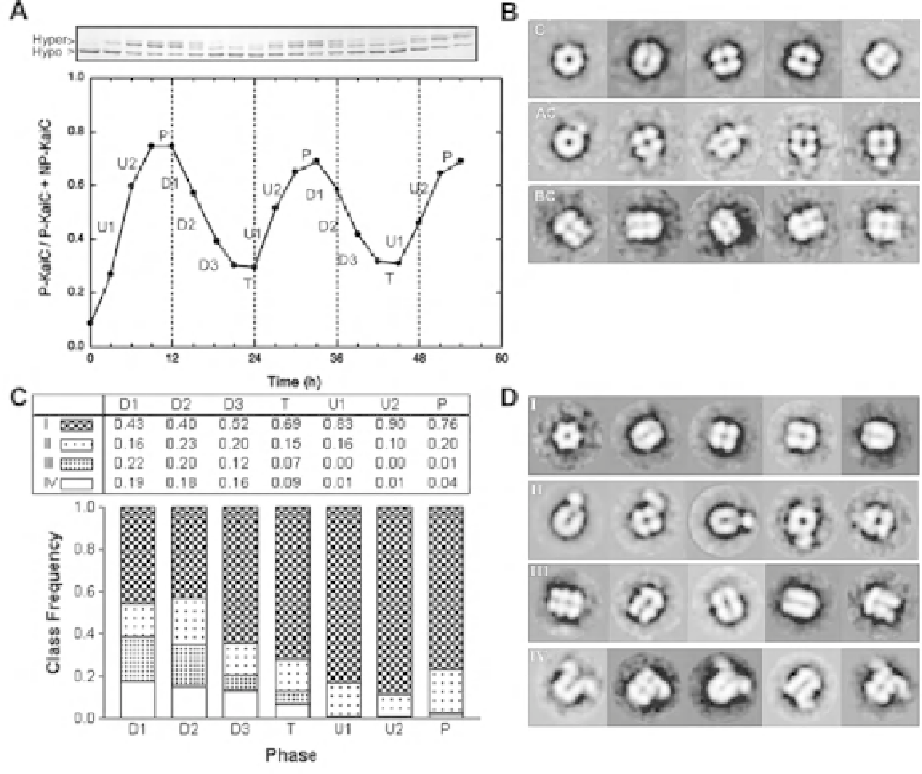
Figure 3:
EM Analysis of the Temporal Sequence of KaiABC Complex Formation.
(A) The
in vitro
oscillation of KaiC phosphorylation (upper panel), in which the lower band is hypophosphorylated KaiC (NP-
KaiC) and the upper bands are different forms of hyperphosphorylated KaiC (P-KaiC). The lower panel is a quantifi cation of
the ratio of P-KaiC to total KaiC (P-KaiCþNP-KaiC) as a function of time. The oscillation cycle is divided into seven phases
for the negative-stain EM analyses in (C) and (D).
(B) Representative EM class-sum images of KaiC alone (labeled C), KaiA-KaiC complexes (AC), and KaiB_KaiC complexes
(BC).
(C) Determination of the relative frequency of the four meta classes at each phase of the KaiABC cycling reaction. The table
reports the meta-class frequencies (top), and is plotted in the histogram (bottom) for each phase (as defi ned in [A]).
(D) Representative EM class-sum images generated for various phases of the KaiABC cycling reaction. The class-sum images
were assigned to one of four structurally distinct meta classes (I-IV). With the kind permission of C. H. Johnson, Department
of Biological Sciences, Vanderbilt University, Nashville, Tennessee, USA [Mori
et al
. (2007)
PLoS Biol
5(4):
e93. doi:10.1371/
journal.pbio.0050093] doi:10.1371/journal.pbio.0050093.g001.
This caused the production of second form of KaiC, i.e. ST-KaiC. Dephosphorylation of ST-KaiC at
its Thr432 favoured the production of S-KaiC but due to the presence of KaiA rephosphorylation of
S-KaiC at Thr432 resulted in ST-KaiC production and the concentration of S-KaiC remained low. But
once the activity of KaiA was reduced, dephosphorylation of ST-KaiC was gradually favoured and