Information Technology Reference
In-Depth Information
6. Notice that the new data collector set has been created and its status is Stopped. Right-click
DCPerformance1
and click
Properties
.
7. Click the
Schedule
tab, where you can create a schedule of when you want the data collec-
tor set to run. Click
Add
. You can choose a beginning date and an expiration date. If you
choose an expiration date, the data collector set stops collecting data after that date. You
can also specify a start time and the days of the week the data collector set should run.
You're going to start this data collector set manually, so click
Cancel
.
8. Click the
Stop Condition
tab, where you specify the duration for running the data collector
set. If no conditions are selected, the data collector set runs until it's stopped manually.
Accept the default value of 1 minute in the Overall duration text box, and then click
OK
.
9. In Reliability and Performance Monitor, right-click
DCPerformance1
and click
Start
. A
green arrow on the data collector set icon indicates it's running. Open and close Internet
Explorer, Server Manager, and Active Directory Users and Computers several times to create
some resource use events.
10. When the status returns to Stopped, right-click
DCPerformance1
and click
Latest Report
.
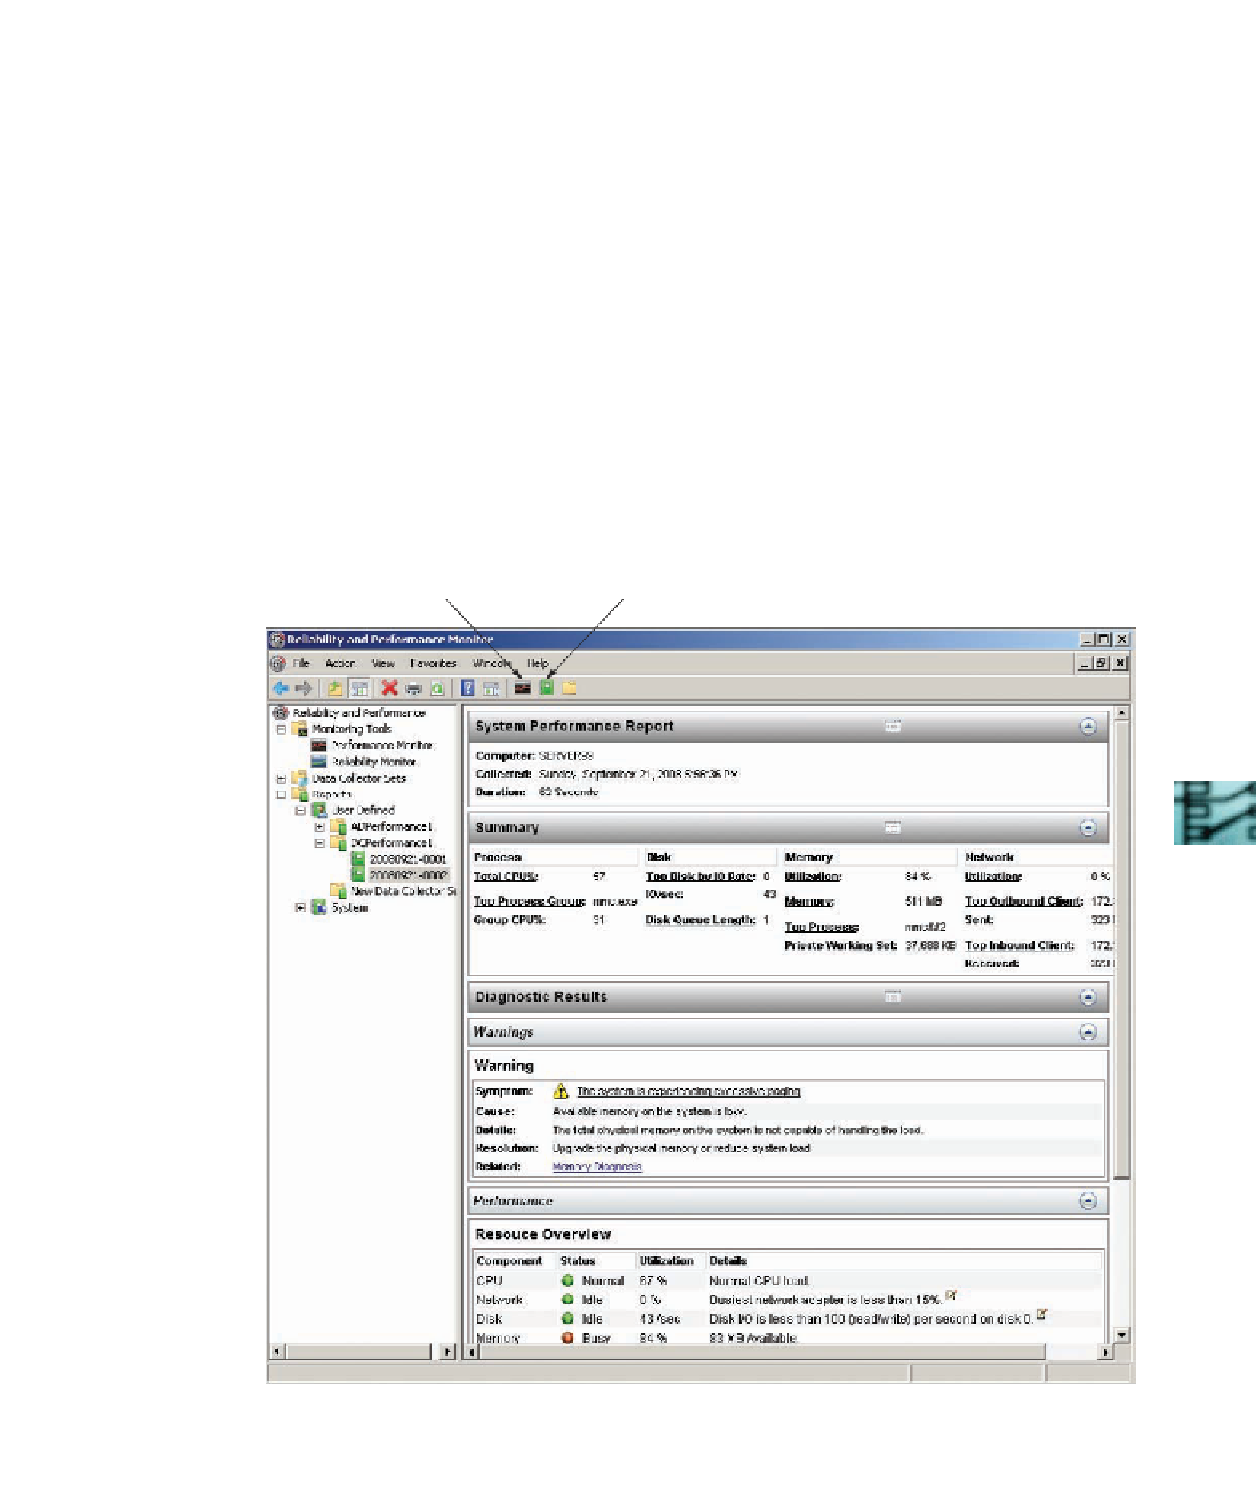
You see a performance report similar to Figure 13-16. In the Diagnostic Results section,
counters with suspect values are flagged as warnings. In Figure 13-16, excessive paging was
detected. Clicking the Memory Diagnosis link opens an Internet Explorer window to a
Microsoft Web site that provides suggestions for solving the problem.
View data in
Performance Monitor
View data as
a report
13
Figure 13-16
Viewing a performance report for a system data collector set
Search WWH ::

Custom Search