Information Technology Reference
In-Depth Information
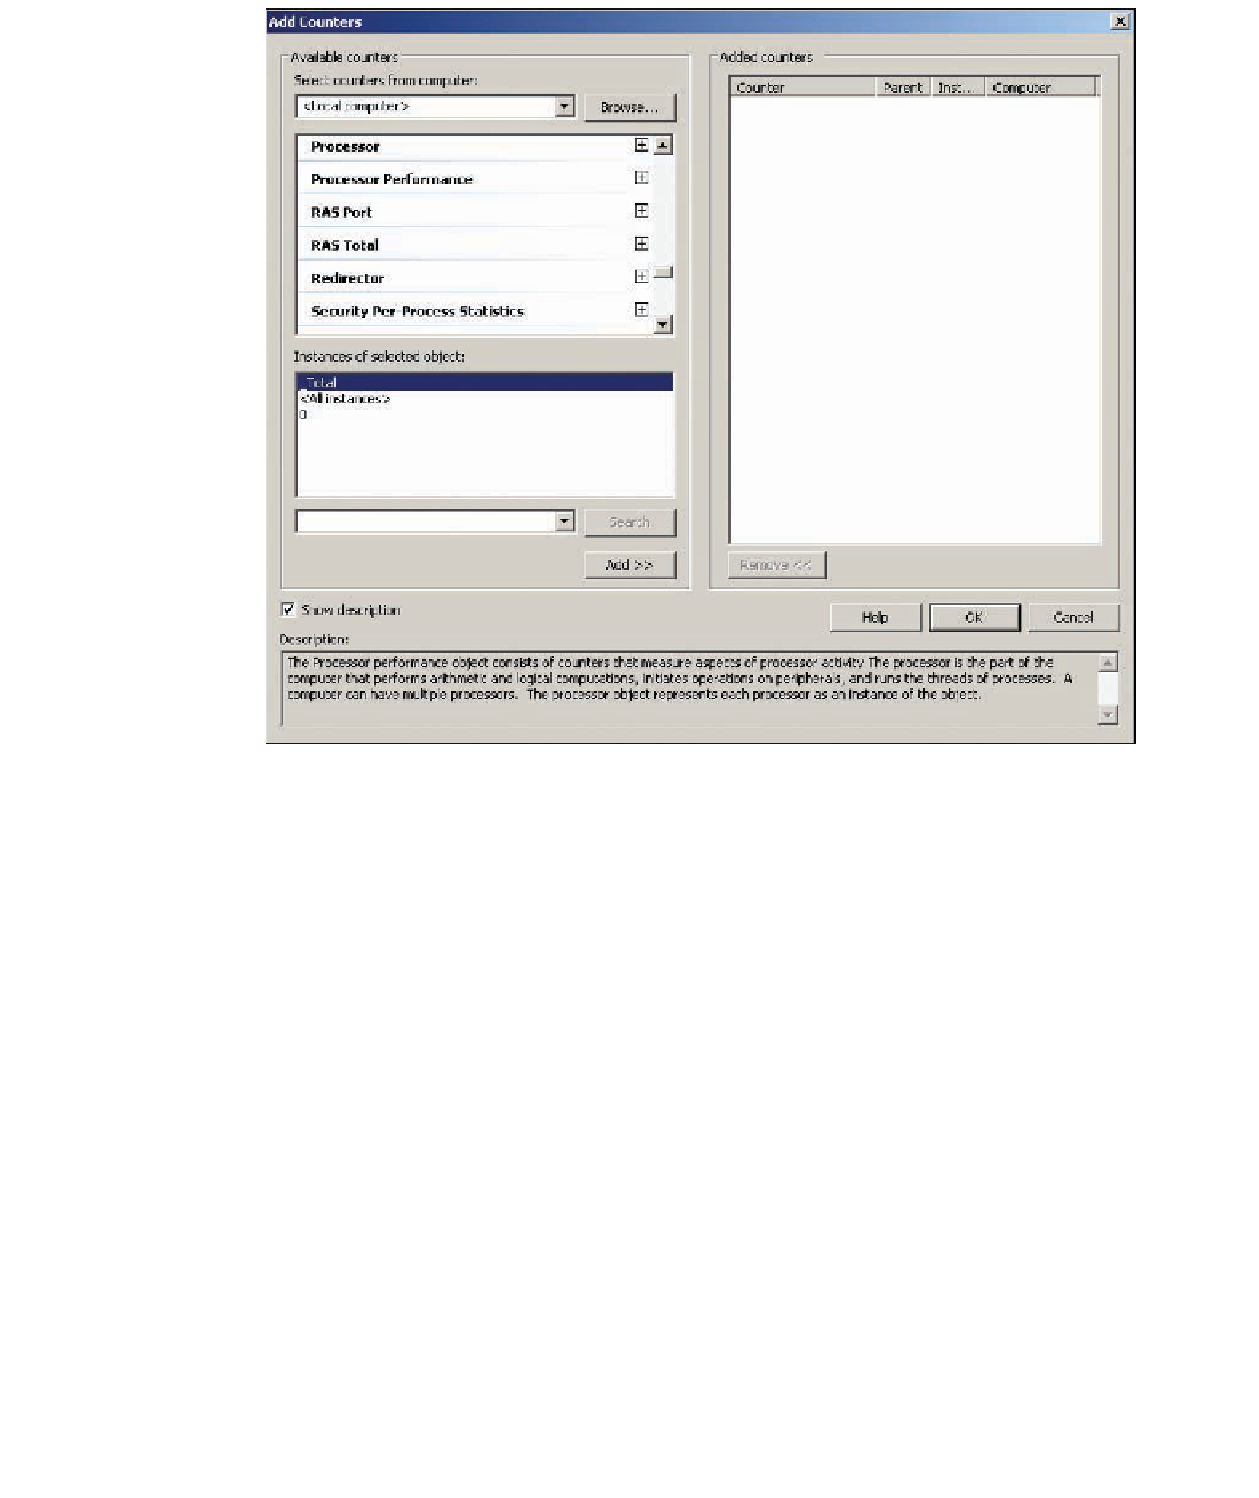
Figure 13-13
The Add Counters dialog box
5. Click the
Show description
check box at the bottom so that you can see descriptions of coun-
ters you select.
6. Scroll through available counters to see what type of data can be monitored. Click
PhysicalDisk
. The Instances of selected object list box displays the physical disk objects you
can select. You can monitor just one disk or multiple disks, or add a counter representing
the total counter values for all disks. Click
0 C:
(assuming disk 0 contains the C drive), click
the
Add
button, and then click
OK
.
7. Notice that several counters have been added to Performance Monitor. In the bottom pane,
click the
Avg. Disk Bytes/Transfer
counter. Emphasize it in the display by clicking the
Highlight
toolbar icon. If the counter isn't showing much activity, create some activity by
opening and then closing Internet Explorer.
8. Right-click
Avg. Disk Bytes/Transfer
and click
Remove All Counters
. When prompted to
confirm, click
OK
.
9. Click the
Add
toolbar icon. In the Add Counters dialog box, click to expand
PhysicalDisk
.
To select a counter for PhysicalDisk, click
% Disk Time
. (If necessary, verify that the
Show
description
check box is selected. You might need to check it whenever you open this dialog
box.) Read the description of the counter, and then click
Add
.
10. Click to expand
Processor
, and click
% Interrupt Time
. Read the description, and then click
Add
. Click to expand
System
, and click
Processor Queue Length
. Read the description, and then
click
Add
. Queue counters indicate how many activities are waiting for work to be done. For
most objects with queue counters (such as PhysicalDisk and Network Interface), a sustained
queue value of more than a few items in the queue often indicates a bottleneck. Click
OK
.
Search WWH ::

Custom Search