Geoscience Reference
In-Depth Information
0.4
0.2
0.0
-0.2
-0.4
Jan
Feb
Mar
Apr
Time of year, 2009
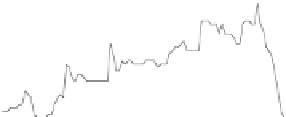
Fig. 4.12
Time series of observed and modelled snow (positive) and ice (negative) thickness in
Lake Vanajavesi. The dark grey line and the asterisk are the observed snow thickness in Jokioinen
and on Lake Vanajavesi, respectively. The circles are the observed average ice thickness and the
spatial standard deviation is indicated by the vertical bar. Modelled snow thickness is the dashed line
and modelled ice thickness is the black line. The heat flux from water is 0.5 W m
−
2
(Yang et al.
2012)
place at the boundaries by positive net surface
fluxes and by the absorption of solar
radiation inside the ice sheet. Internal melting gives rise to structural defects and once the
porosity of the ice reaches 0.3
fl
0.5, the ice cannot bear its own weight, breaks into smaller
pieces into the water, and a rapid increase in the rate of decay follows. In warm ice and
snow liquid water inclusions co-exist with the solid-state ice crystals. The ice and snow
cover becomes a two-phase system, where the proportions of the solid and liquid phases
change according to heat
-
fl
fluxes. The properties of this system also change with the phase
proportions.
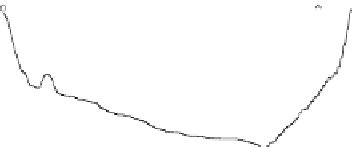
Fig. 4.13
Time series of
observed and simulated ice
thickness based on varying heat
flux from water: 0 W m
−
2
(black dashed), 0.5 W m
−
2
(black solid), 2 W m
−
2
(grey
dashed) and 5 W m
−
2
(grey
solid). Measurements of ice
thickness are shown as in
Fig.
4.12
(Yang et al. 2012)
0.0
-0.2
-0.4
Jan
Feb
Mar
Apr
Time of year, 2009


Search WWH ::

Custom Search