Environmental Engineering Reference
In-Depth Information
identification, definition and differentiation from
minerals or other clasts (image segmentation) was
carried out by using adobe Photoshop software.
Pores have been isolated by using a color-scheme
selection tool. This step for pore isolation was sup-
ported and confirmed by thin section analysis and
petrographical description (mineral constituents,
rock texture, crystal size range, and porosity types).
Final processing included a more accurate image
segmentation and image calibration performed by
has been identified, porosity shape parameters
(location, perimeter, surface area, circularity and
aspect ratio) have been automatically extracted.
image analysis on thin sections results in a 2D
description of pore distribution and it is important
to derive a 3D porosity description. Different tech-
niques to characterize spatial structure and sizes
of randomly distributed particles/voids from two-
dimensional sections are available and can result
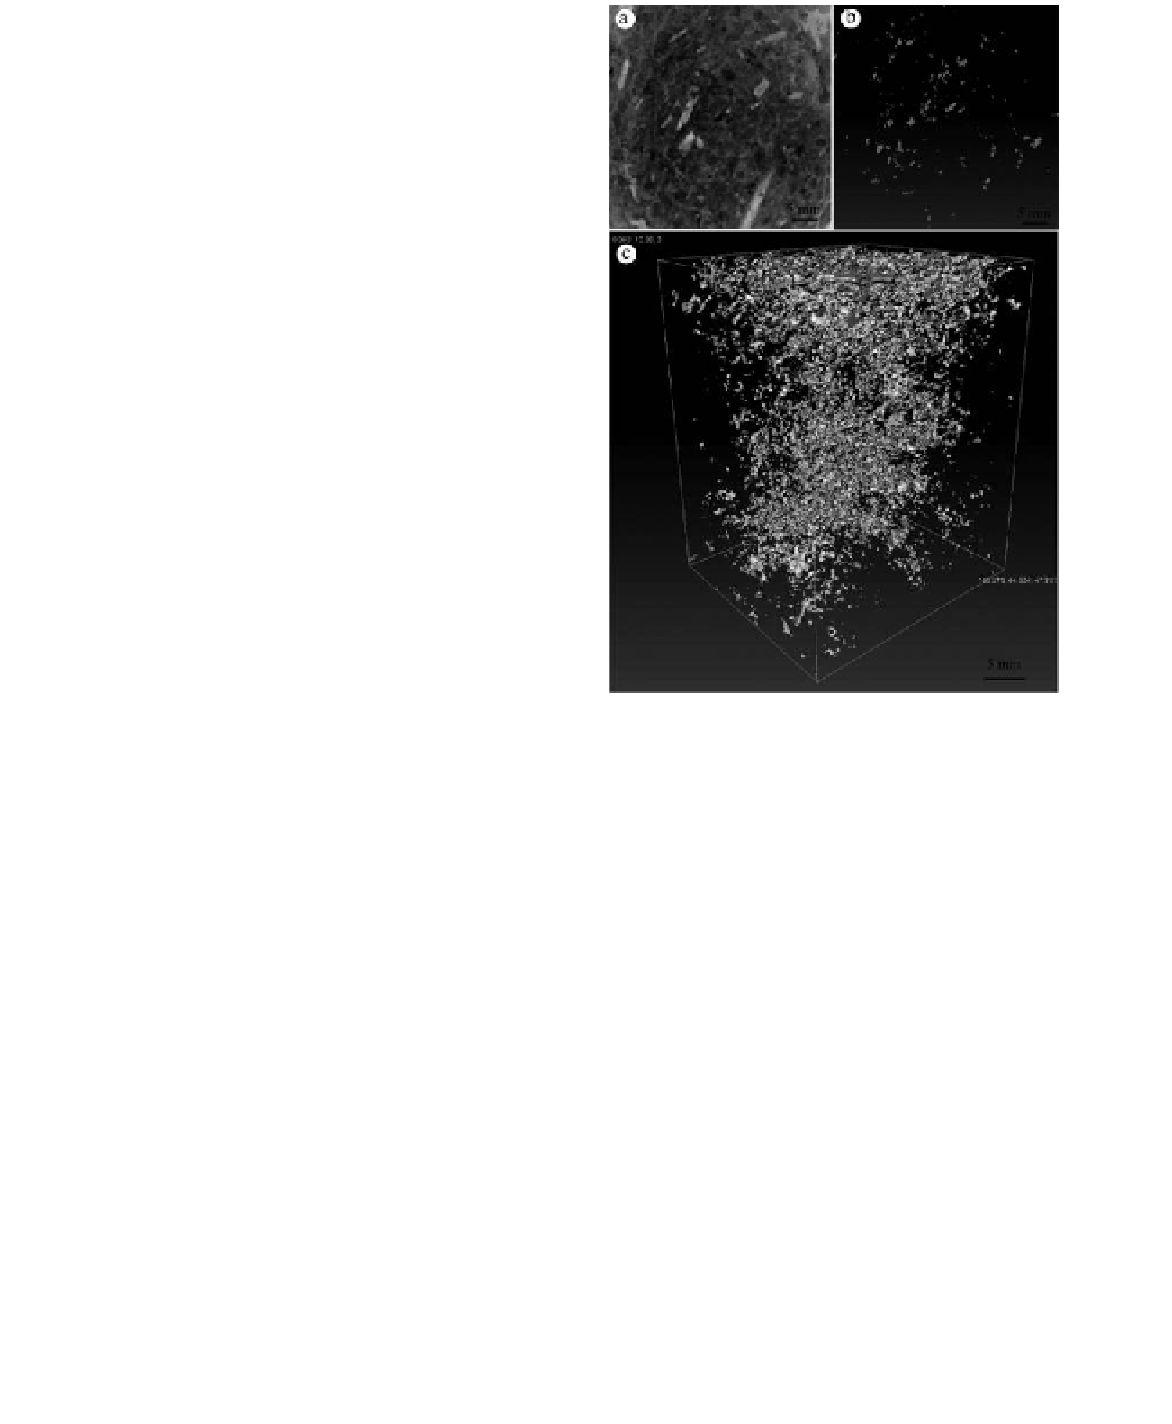
Figure 3. (a) example of a filtered image reconstructed
from a tomographic slice through sample sl4. (b) pre
distribution obtained from thresholding of image (a).
(c) 3D pore-system reconstruction (avizo 6).
in different values. stereological methods could
allow to determine the number of particles for
each particular size and shape enclosed by a given
volume from the observed number of particle cuts,
of a particular size and shape, on a randomly ori-
ented cross-section through the volume (sahagian
and Proussevitch, 1998). stereological conversion
techniques have been used for geosciences fields
(higgins 2000, and Morgan and Jerram 2006).
higgins (2000) have applied stereology to quan-
tify textural aspects of igneous rocks (e.g. crystals
sizes and distribution) by processing a sequence
of thin-section images. We followed a simpler
approach proposed by Farmer et al. (1991) to com-
pute the 3D porosity by 2D shapes by applying the
two relationships: V = ab and V = [a(a + b)/2]
where a is pore area, a and b are the major and
minor axes, respectively. Because of the subspheri-
cal geometry a and b are similar and the results of
the two results are comparable.
a more complete three dimensional recon-
struction of rock sample structure and porosity
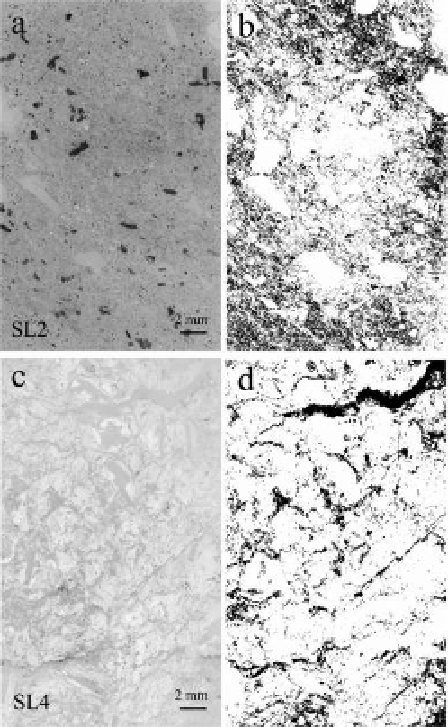
Figure 2. illustration of the two steps performed in
image processing of thin sections by imageJ (nih).
(a, c) original scanned images of thin sections of sl1 and
sl4 samples, respectively. (b, d) images as obtained after
the segmentation process.