Environmental Engineering Reference
In-Depth Information
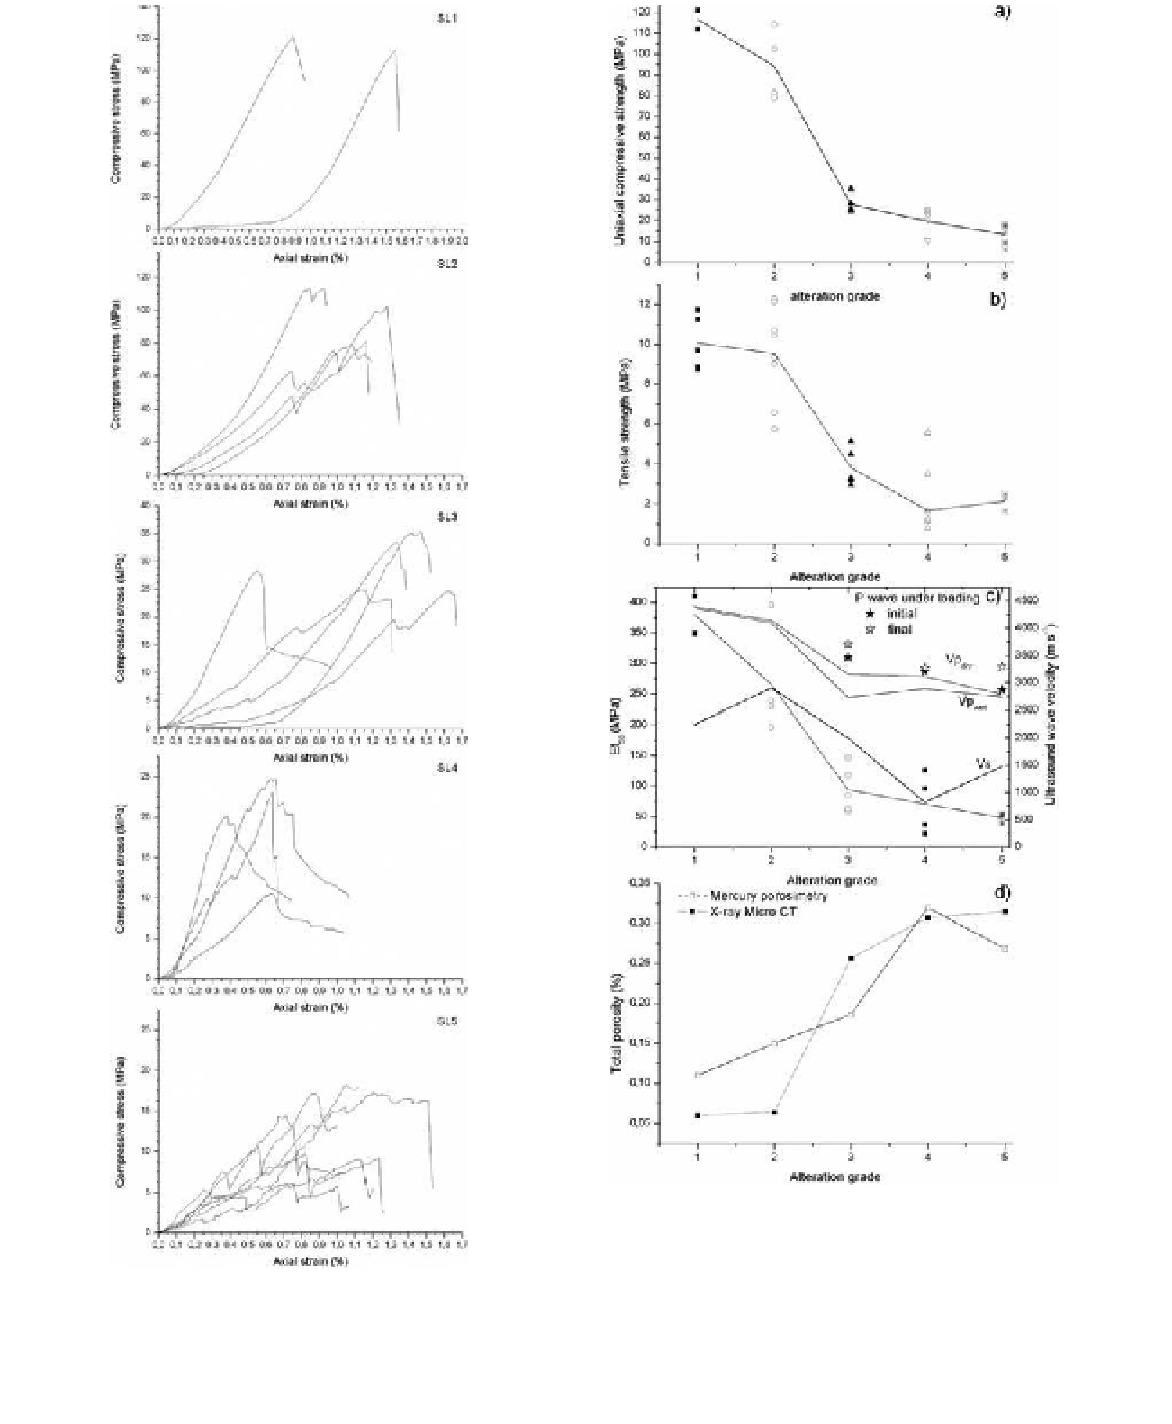
Figure 3. Test results plotted with respect to the altera-
tion grade a) uniaxial compressive b) indirect tensile tests,
c) elastic modulus, et
50
(various symbols) and ultrasonic
P-wave (dry and wet) and s-wave velocity (lines) under
unloaded and loaded conditions. The filled and empty
stars represent the initial and final P wave velocity values
during compression tests, respectively; d) total porosity.
Figure 2. stress vs displacement curves for the tested
samples presented according to their alteration grade
(1 to 5).