Environmental Engineering Reference
In-Depth Information
200
100
SG
Shear zone Test 2
Shear zone Test 3
Shear zone Test 5
Shear zone Test 6
Inner shear zone Test 6
Outer shear zone Test 6
S20
Total stress path
Effective stress path
Stop
80
150
A
60
100
C
40
50
20
B
Start
ϕ = 39°
0
0
0.01
0.1
1
10
0
50
100
150
200
250
Grain size (mm)
Normal stress (kPa)
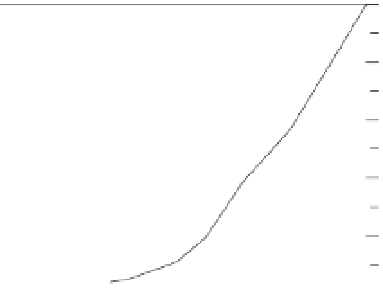
Figure 11. Grain size distributions determined on the
original material (sG) and on the material forming the
shear zones of specimens from different tests.
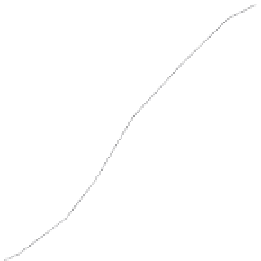
Figure 9.
effective and total stress paths during test #5.
0.80
0.75
of 20 m, experienced severe crushing. its grain
size distribution is very similar to that determined
by Boldini
et al
. (2009), denoted as s20, in stress-
controlled ring shear tests carried out to values of
shear displacement larger than 30 m.
Finally, the grain size distribution of the shear
zone in test #5, despite the limited shear displace-
ments reached at the end of the experiment, indi-
cates that a significant crushing occurred, which
helps in explaining the limited liquefaction phe-
nomenon observed soon after the increase in shear
displacement.
0.70
0.65
0.60
0.55
0.50
0
0.2
0.40.6
0.811.21.4
1.6
Shear displacement (m)
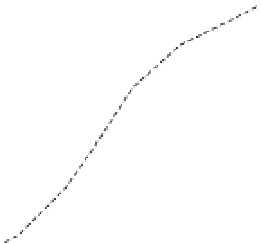
Figure 10.
Void ratio decrease recorded during test #5.
5
conclUsiVe ReMaRks
build-up of pore water pressure as a consequence
of intense grain crushing in the shear zone. evi-
dence of this is the significant decrease in void
ratio recorded during the test (
Fig. 10
). The final
void ratio determined for the shear zone is equal
reported in section 4.1 disregarding swelling of the
specimen (about 2 mm), following the opening of
the apparatus.
The new lRsT testing programme confirmed pre-
vious results and gave new insight into the texture
modification experienced by the volcaniclastic
material during shearing.
The high susceptibility of the stromboli vol-
caniclastic soil to static liquefaction, observed in
previous and new tests conducted under stress-
controlled undrained conditions, was confirmed
by displacement-controlled tests performed with
open drainages. even though a threshold for the
insurgence of static liquefaction was neither estab-
lished, nor could be easily extended to the real
slope, a specimen tested at high displacement rate
(100 mm/s) temporarily experienced shear failure,
whilst specimens sheared at 5 mm/s did not exhibit
any significant drop in shear resistance. This
behaviour could be assimilated to the limited liq-
uefaction described by castro (1969) in undrained
triaxial tests. alternatively, since drainages are
open, the strength recovery could be simply due to
the dissipation of the excess pore pressure.
4.3
Grain size distribution after shearing
The grain size distribution of the shear zone mate-
rial was determined for different tests (
Fig. 11
).
The grain size distribution of the inner and outer
shear zone of test #6 specimen is also provided.
Figure 11 shows that the material from the shear
zone of tests #2 was subjected to a very limited
crushing and the corresponding curves almost
match that of the original material sG.
conversely, the material forming the inner shear
zone of test #6, subjected to a shear displacement