Environmental Engineering Reference
In-Depth Information
5.3
Displacement and stresses based on elastic
and elasto-plastic models
six different geological-geotechnical models were
analyzed: a) the cone (layer i) with the founda-
tion (layer iV) with a constitutive elastic model,
b) the cone with the foundation and an intermedi-
ate layer majorly formed by pyroclastics (layers ii
and iii) in an elastic way, c)the effect of the cone
on its foundation in a elasto-plastic way, d) the cone
(layer i) developed on a pyroclastic level (layer ii
and iii) in a elasto-plastic way, e) the growth of the
cone by stages and f) the effect of the recent lava
field (particularly develop between 1968 and 1973)
monitoring, are observed still at distances of 5 km
from de axial principal area of the flows (maxi-
mum thickness of the lava field), 41 years after its
effusion. Based on the data of the precise leveling
campaigns at the sakurajima Volcano in Japan
field of 1946, it was evident that a local subsidence
was superimposed to the regional deformation
at the bottom of the volcano, still 56 years after
the emplacement (24, 42). The same phenomenon
has been observed at the etna (italy), in recent
investigations on leveling and inclinometry. in the
sakurajima case, the lava thickness in the defor-
mation areas is around 50 m, and there is not any
local subsidence beyond 1.7 km from the lava axis.
at the etna Volcano, the subsidence is still active,
more than three decades after its emplacement, in
compound flows that reach thickness between 70
and 75 m and its effects are perceptible 200-300 m
away from the border of the lava flows and more
than 1 km from its axis. The deformation rate at
a distance of 1 km from the flows axis is in the
order of 40 µrad/year. in this case, the lava field is
wider than the one at the sakurijama Volcano and
5.4
Deformation based on inclinometry
The detected deformations at the dry inclinom-
etry stations of the arenal volcano, for volcanic
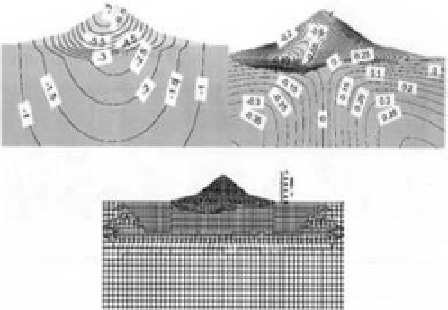
Figure 8a. Finite element analysis of the arenal cone:
Vertical (left) and horizontal (right) deformation in
meters.
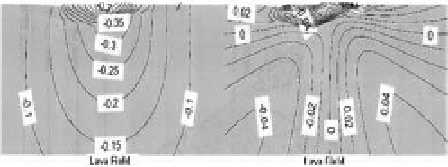
Figure 8b. elastic deformation (a: vertical; b: horizon-
tal in cm) for a lava field of 150 m of thickness.
Table 8.
comparison of movements and stresses under different cases and models.
Maximum Vertical
(V) and horizontal
(h) Displacements
constitutive
model
case of study
stresses (kPa)
comments
elastic
cone +
Foundation
V = 4.95 m
h = 0.39 m
V = 16 157
h = 7500
cone (layer i) on pyroclasts
(layers ii and iii) +
Foundation (layer iV)
elastic
horizontal deformation influence
zone extends to 4800 m
V = 7 m
h = 0.42 m north y
1 m south
V = 19 875
h = 10 425
elasto-plastic
horizontal deformation influence
zone extends to 4830 m
cone
+
Foundation
V = 4.98 m
h = 0.39 m
cone + Pyroclastic layer
elasto-plastic
V = 7.16 m
Plasticized sectors in the flanks,
part of the volcano, foundation
and surrounding setting.
Growth of the volcano in
3 stages
elasto-plastic
The plasticized sectors appear
during the first stage (300 m)
to manifest in the next two
stages, at 700-900 m
V = 6.35
h = 0.89 m south y
0.26 m north, near
the foundation
lava field (150 m thickness)
on layers iii and iV
elastic
V = 72 cm
h = 4-11 cm
V = 362.53
h = 2014.4
consolidation process is not
considered