Environmental Engineering Reference
In-Depth Information
jointed block and confinement on a fifth side was
available too. Unusually for jointed rock masses,
neither concave nor convex load-deformation curves
were produced: rather the load-deformation was
linear when performed across the part-columnar
part entablature jointing.
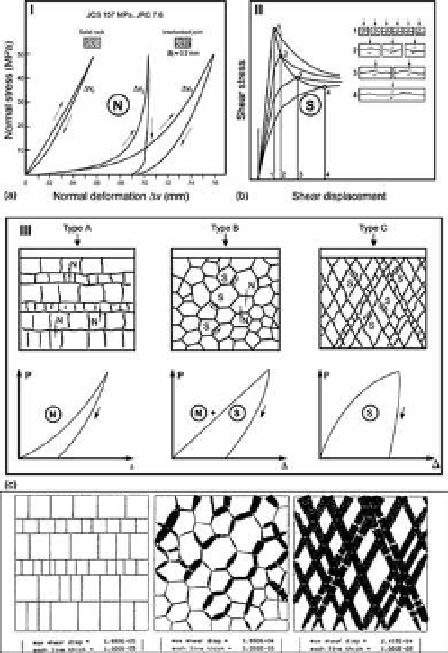
Figure 8 suggests how this may be due to the
combination of joint closure phenomena (concave)
and joint shearing tendencies (convex). UDec-BB
Figure 7. seismic and other physical measurements in
the face of the tunnel in basalt. Zimmermann and king,
(1985).
Figure 6. The vertical and horizontal ray-paths showed
great contrast due to the low stress across columnar
cooling joints.
The large contrasts in Vp values for the vertical
path (#1 to #2) and for the horizontal path (#3 to
#4) close to the opening (1.5 to 2.0 km/s difference)
are the most clear indication of the easily disturbed
columnar jointing. There is also some indication of
a tangential stress concentration effect: the back-
ground (far-field) velocity of about 5.4 to 5.8 km/s
appears to be elevated by about 0.5 m/s from about
4 to 8 m depth in the wall, with a lower background
velocity.
The authors registered no consistent trend in
RQD values with depth, but increased crack density
was seen close to the opening. The velocity reduc-
tions seem to be a product of blast-damage, stress
relief (and redistribution) and possible reduction
in moisture content. The authors noted water flow
from some of the horizontal holes during the tests,
and had originally assumed more or less saturated
conditions. however, Figure 7 does show a change
in saturation level.
These results are presented in order to emphasise
the possibility of drying out of some of the joints,
despite water flow from some of the holes. The
theoretical analysis of crack density did not appear
to be supported by the RQD measurements in gen-
eral, but is perhaps an expression of joint void ratio
changes, with the joints closest to the tunnel wall
showing the largest voids and therefore suggesting
an apparent (but false) increase in joint density.
a sophisticated heated block test was one of the
main components of the
in situ
testing at BWiP.
Flat jacks were used to load four sides of the large
Figure 8. conceptual explanation of concave, linear
and convex load-deformation curves obtained from in
situ testing, and UDec-BB modelling result showing
respective joint shearing magnitudes. Barton (1986), and
nGi modelling team.