Environmental Engineering Reference
In-Depth Information
Table 1.
Data sets (h-B and M-c criterion).
Table 2. Relative deformation by variation of h-B and
M-c parameters.
Data set 1-1
Data set 1-2
Data set 2
Data
set 1-1
Data
set 1-2
Data
set 2
Young's
modulus, e
(Mpa)
1380
1380
40000
10.8
12.8
8.6
s
2
3
p
s
=
3
∼
s
Poisson's
ratio,
v
0.25
0.25
0.2
r
p
5.6
6.8
4.3
=
2
3
initial stress,
po
(MPa)
3.31
10
*
108
s
s
∼
s
r
p
p
Radius of
tunnel,
r
i
(m)
5.35
5.35
4
25.5
12.6
8.9
m
2
3
p
m
=
∼
m
r
p
3
δ
c
(Mpa)
27.6
30
300
8.5
5.9
6.6
=
2
3
m
p
0.5
4.5
7.5
mmm
r
∼
s
p
0.001
0.02
0.1
p
p
m
r
0.1
0.45
*
1
116.5
59.4
42.5
c
2
3
p
s
r
0
0.002
*
0.01
c
=
3
∼
c
r
p
33
*
43
*
46
*
ϕ
p
21
*
24
*
29
*
ϕ
r
26.7
18.2
13.8
=
2
3
∼
c
c
c
c
p
(Mpa)
0.38
*
1.61
*
23.17
*
r
p
p
c
r
(Mpa)
0.19
*
0.73
*
11.34
*
282.3
76.8
39.5
ϕ
2
3
ψ
p
19.47
27
*
35
*
p
ϕ
=
3
∼
ϕ
r
p
5.22
0
0
ψ
r
0.004742
0.004742
*
0.004
*
γ*
54.5
33.6
24.6
=
2
3
ϕϕϕ
r
∼
p
p
* assumed value.
suppose that
s
r
parameter changes gradually
into
s
2
3
, and
s
p
. as it is observed from figure 3a,
increase of
s
r
parameter reduces displacement at
the opening surface for data set 1-1, this behavior
is the same for data set 1-2 and 2. suppose that
the relative displacement is obtained by division
of the displacement at special
s
p
s
p
3
S
3
(,
2
3
s
or
s
)
r
p
p
to the displacement in which
s
r
becomes equal to
its real value of rock mass (the relative deforma-
tion for other rock mass parameters are calculated
in the same way). The relative deformation for a
rock mass with elastic-brittle plastic behavior (data
set 2) is smaller than that of strain softening rock
mass.
in the next stage parameter
m
r
of rock mass
changes into
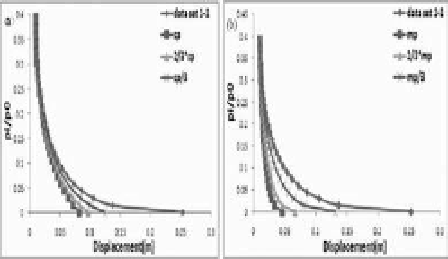
Figure 3. effect of variation of
s
r
(a) and
m
r
(b) param-
eters on GRc for data set 1-1.
causes smaller relative deformation in rock masses
in elastic-strain softening behavior. Therefore, it
should be attempted to keep
m
and
s
parameters
on values larger than
m
2
and
Figure 3b shows
that increase of
m
r
parameter makes a reduction
with displacement for data set 1-1. This behavior
is repeated for data set 1-2 and 2. it is inferred
based on table 2 that relative displacement for data
set 1-1 is larger than that of data set 1-2 and for
data set 1-2 is also larger than that of data set 2.
it shows that variation of
m
r
parameter causes
smaller relative displacement with increase of rock
mass quality.
it is observed from table 2 that keeping
m
and
s
constant is more important for medium qual-
ity rock masses. specially reduction of
m
r
and
s
r
parameters into values less than
p
,
m
.
p
3
3
m
p
3
m
p
and
2
3
s
p
by means of
mechanical excavation or controlled blasting.
sensitive analysis of Mohr-coulomb param-
eters is investigated in this stage. First
c
r
parameter
changes into
2
c
2
3
, , and
c
p
. Figure 4a shows that
increment of
c
r
parameter causes a reduction in
rock mass deformation for data set 1-1, this behav-
ior is the same for data set 1-2 and 2. it is observed
from table 2 that relative displacement for data
set 1-1 is larger than that of data set 1-2 and for
data set 1-2 is also larger than that of data set 2.
p
3
c
p
2
3
m
p
2
3
s
p
and