Hardware Reference
In-Depth Information
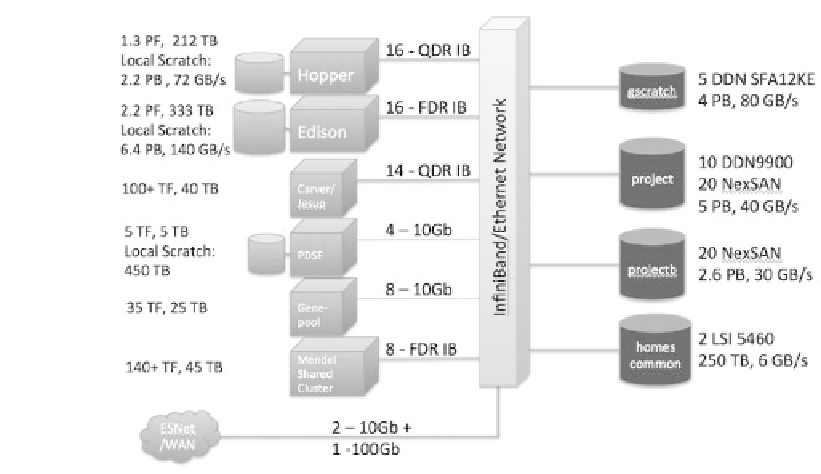
FIGURE 2.1: NERSC systems chart that shows how NERSC compute and
storage systems are interconnected with each system's attributes. Table 2.1
enumerates these values in further detail. [Image courtesy of Shane Canon
(NERSC).]
to replace portions of the file system (network, storage, and servers) as they
age to about the five-year point. This benefits users by continuing to provide
bandwidth and capacity regardless of computational system modification and
work. Table 2.1 summarizes the parallel I/O systems at the facility that will be
discussed. Though the names and characteristics (capacities and bandwidth)
will change over the years, the categories of storage systems will remain the
same for the foreseeable future.
2.2.1 Local Scratch File Systems
Currently, all computational systems, except the mid-range system called
Carver, have dedicated local scratch file systems. This is to minimize con-
tention of I/O bandwidth, thereby improving the utilization of the system.
The strategy works very well for keeping stable or consistent performance on
each local scratch file system. The other main aim of providing local scratch
independently for each computational system is that bandwidth may be provi-
sioned based on the amount of main memory available on each computational
system. On systems where file system bandwidth approaches 1 GB/s for each
1 TB of main system memory, user satisfaction with the file system is high.
In general, all local scratch file systems are purged of files older than about