Geology Reference
In-Depth Information
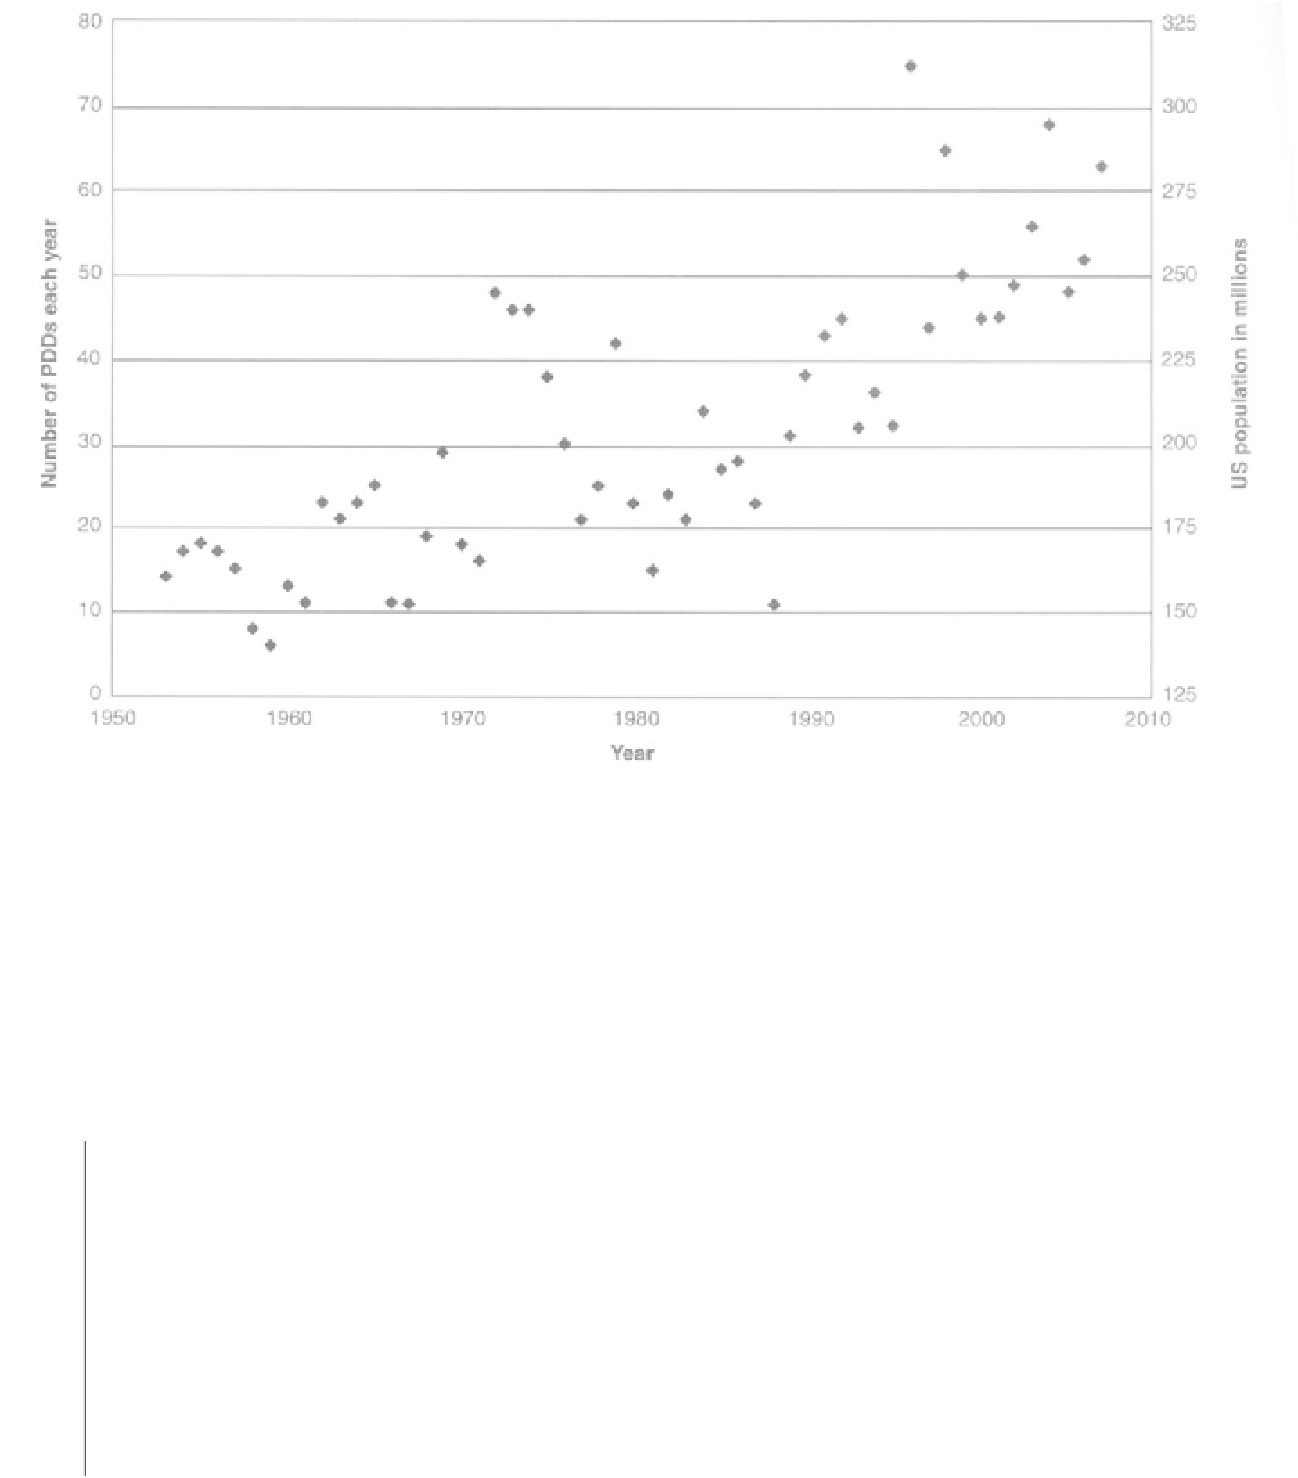
FIGURE
11
.5
Annual number of Presidential Disaster Declarations (PDDs), 19S3-2007. Disaster declaration data from
http://www.fema
.gov/news/disasters_totals_annual.fema (downloaded August 10, 2008). Population data from
http://www.census.gov
.
11.
Refer to the data in Table II.1. Use the scale on the right
side of the graph and plot these points on the graph. Draw a
line that connects the points you placed on the graph. What
is the correlation between the number of Presidential Disas-
ter Declarations and population growth?
Geologic hazards and plate tectonics
13.
Refer back to Figure II.2, the state map of hazards, and to
your map of plate boundaries that are drawn on Figure ILL
a.
Where is your state located in relationship to plate
boundaries?
b.
What geologic hazards are more typically found near
plate boundaries?
Year
US Population in millions
2007
303
c.
What hazards are found typically away from plate
boundaries?
2000
282
1990
250
1980
228
14.
Refer back to Figure II.3, the map of Presidential Disaster
Declarations, and to your map of plate boundaries. Describe
and explain the relationship, if any, of PDDs with plate
boundaries. For example, is the number of PDDs near plate
boundaries greater, about the same, or lower than the num-
ber of PDDs away from plate boundaries?
1970
205
1960
181
1950
152
Table II.1, US population in millions of people (data
from US Census Bureau).
12.
List several strategies that might help decrease the num-
ber of Presidential Disaster Declarations. It may be helpful to
think again about this question near the end of your course.