Geology Reference
In-Depth Information
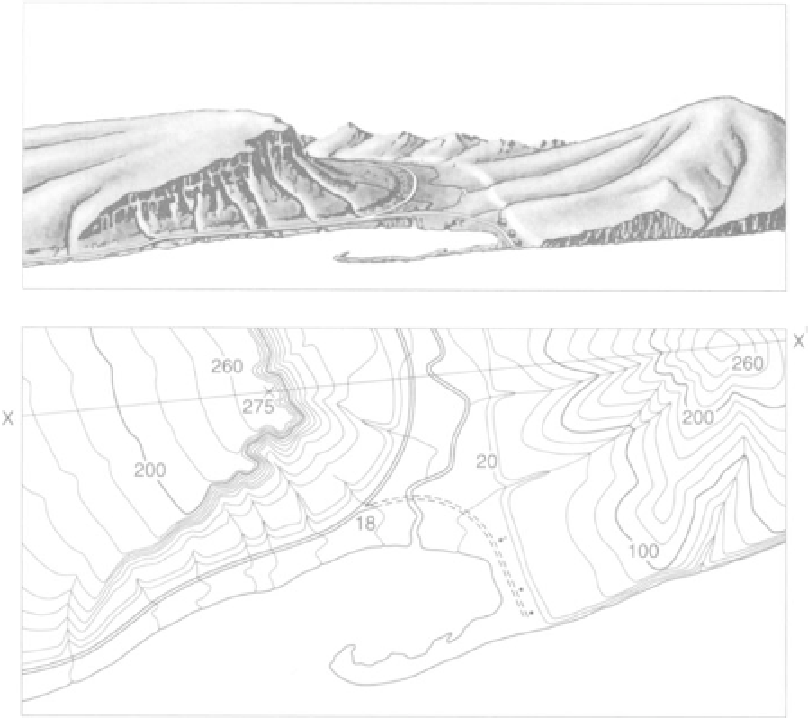
FIGURE 2.4
Topography expressed by contour lines. (USGS)
THE USE OF SYMBOLS IN MAPPING
These illustrations show how various features are depicted on a topographic map. The upper illustration is a perspective view of a river
valley and the adjoining hills. The river flows into a bay which is partly enclosed by a hooked sandbar. On either side of the valley are
terraces through which streams have cut gullies. The hill on the right has a smoothly eroded form and gradual slopes, whereas the one
on the left rises abruptly in a sharp precipice from which it slopes gently, and forms an inclined tableland traversed by a few shallow
gullies. A road provides access to a church and two houses situated across the river from a highway which follows the seacoast and
curves up the river valley.
The lower illustration shows the same features represented by symbols on a topographic map. The contour interval (the vertical dis-
tance between adjacent contours) is 20 feet.
2.
Contours separate all points of higher elevation than
the contour from all points of lower elevation.
3.
The elevation represented by a contour line is always
a simple multiple of the contour interval.
4.
Usually, every contour line that is a multiple of five
times the contour interval is printed as a darker line
than the others.
5.
Contour lines never intersect or divide, they may,
however, merge at a vertical or overhanging cliff.
6.
Every contour closes on itself either within or
beyond the limits of the map.
7.
Contours that close within a relatively small area on
a map represent hills or knobs.
8.
Steep slopes are shown by closely spaced contours,
gentle slopes by widely spaced contours.
9.
Uniformly spaced contour lines represent a uniform
slope.
10.
Minimum valley and maximum ridge contour
lines must be in pairs. That is, no single lower con-
tour can lie between two higher ones, and vice
versa.
Topographic Profiles
Topographic maps represent a view of the landscape
from above, and even though contour lines show the
relief of this landscape, it is often desirable to obtain a
better picture of the actual shape of the land in an
area. This can be achieved by constructing a topo-
graphic profile, that is, a cross section of the Earth's
surface along a given line. Profiles may be con-
structed quickly and accurately from topographic
maps using graph paper. The procedure for con-
structing a profile along a selected line on the map is
as follows:
1.
Examine the line of profile on the map and note the
elevations of the highest and lowest contour lines
crossed by it. Select a vertical scale that fits the graph
paper and note how many inches or centimeters on
the graph paper correspond to a selected vertical ele-
vation interval. For instance, one inch on the graph
paper might equal 10,100, or 1,000 feet (or 120,1,200,
or 12,000 inches) of relief in your cross section. Label
on the graph paper equally spaced horizontal lines
that correspond to the elevation of each contour line