Geology Reference
In-Depth Information
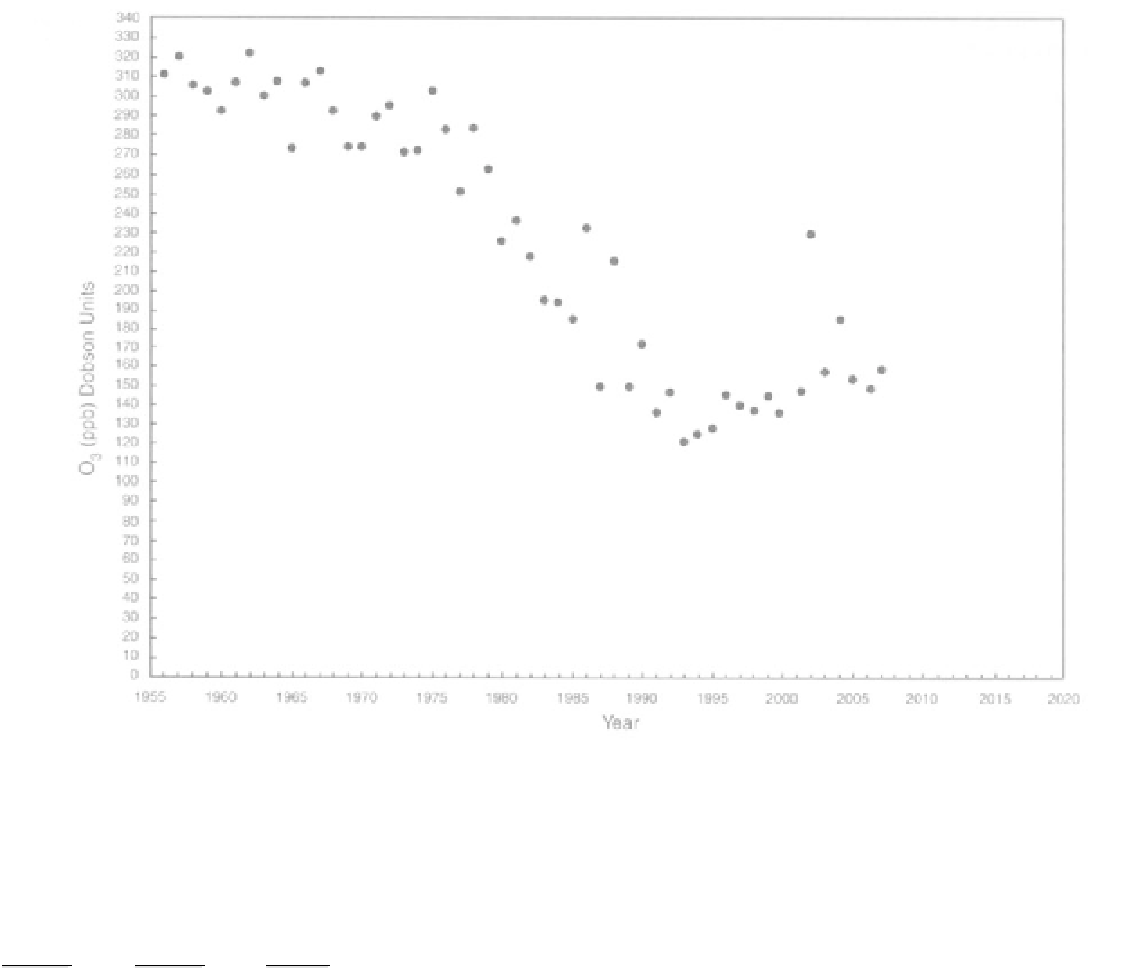
FIGURE 18.7
Provisional mean total column ozone at Halley (76° S), Antarctica, for October. Data from Jon Shanklin (personal
communication, 1998) and updated (2008) with permission from National Environment Research Council - British Antarctic Survey site
(
http://www.antarctica.ac.uk/met/jds/ozone/data/ZOZ5699.DAT
)
. Additional ozone information at
http://www.antarctica.ac.uk/
met/jds/ozone/.
5.
What is the average value for the October concentration of
ozone in the stratosphere over Halley Station, Antarctica, in
1956?
10.
In addition to the October decrease in ozone, there has
been a corresponding increase in the area of the ozone hole.
Fortunately few people live in Antarctica (mainly scientists),
but ozone could impact marine life (productivity of plank-
ton), an important component of the world's life support
system. Check the WEB for more recent data on the October
average ozone value at Halley Station.
in 1972
in 1993
6.
On Figure 18.7 sketch a smooth best-fit curve through the
data. About when did the rate of decline change significantly?
11.
Why were the nations able to reach agreement on CFC
reduction? (give several factors)
7. What was the average annual decrease or rate of change
(ppb/year) from 1972 to 1993?
8.
Draw a straight trend line through the 1972 and 1994 data
points to the bottom axis. What might you conclude about
the ozone problem from dates available at the end of 1994?
PART C. C0
2
. POPULATION, AND °C
CHANGE
A rise in CG_ concentration and other greenhouse
gases "(including water vapor, methane, nitrous oxide,
carbon monoxide, and others.) in the atmosphere will
produce warmer climates in the future. With a doubling
of
CO2
in the atmosphere to about 700 ppm it has
been estimated that there would be an increase in
temperature of about 2 to 4°C. According to models,
9.
From data up to 2004, what might you conclude about
society's response to the ozone problem?