Geology Reference
In-Depth Information
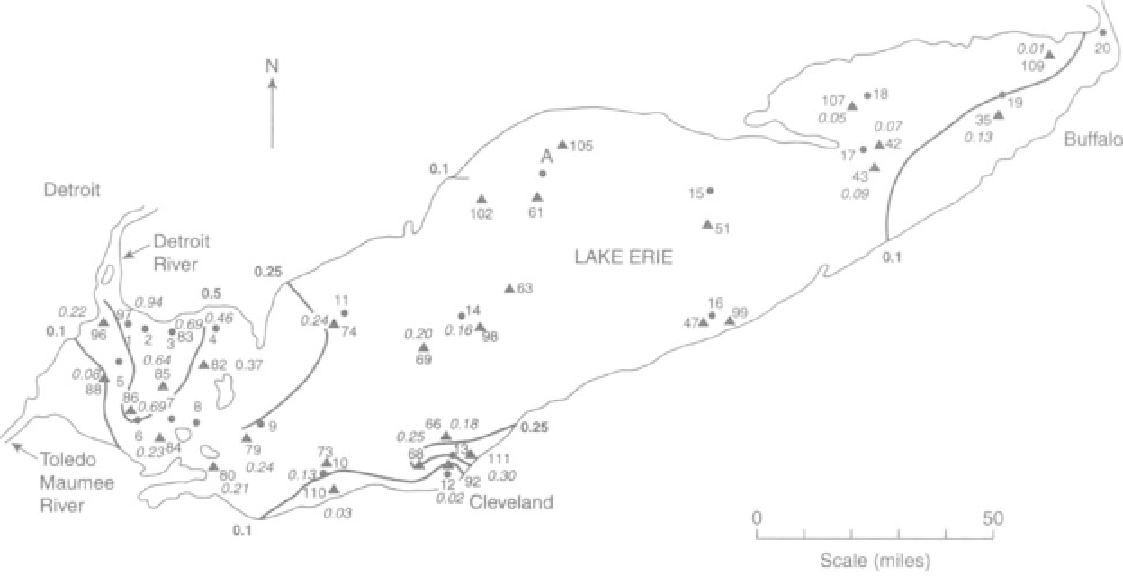
FIGURE 14.3 Concentration of mercury in sediment on the bottom of Lake Erie in 1997/98. Numbered dots [1-20] are the 1971
sampling sites (no mercury values plotted); triangles, the 1997/98 sites. Italicized numbers beside the triangles are mercury concen-
trations in 1997/98. Some contours given; values in bold. Other 1997/98 values to be added. Sites 1 and 97, 3 and 83, and 4 and 81 are
represented by a dot only.
b. What might explain such increases that do not repre-
sent the trend for contaminant concentrations?
Downstream from Leavittsburg, particularly in
Warren and Youngstown, was a huge industrial com-
plex with an abundance of steel mills. Steel-mill waste-
waters, which were once dumped into the river,
contained high concentrations of chloride and sulfate
(from spent hydrochloric and sulfuric acid) and of iron
and other metals, had low pH (from the acid), and
were heated (having served as cooling water).
As temperatures increase, the ability of water to
hold dissolved oxygen (DO) decreases. According to
State of Ohio regulations for protection of aquatic life
in designated warmwater-habitat streams the mini-
mum DO is 4 mg/L.
Conditions along the Mahoning River have
changed with the introduction of EPA regulations and
the closing of steel mills for economic reasons since these
data (1963-65) were obtained. We begin Part B by look-
ing at the river prior to improvements in water quality;
this is the type of contamination that may exist today in
other regions of the world where industrial pollution is
minimally regulated. Then we look at the current condi-
tions that result in today's human health advisory for
the Mahoning River and explore options for improv-
ing the environmental quality (and economic potential)
of the river. In 2005, the Mahoning River was one of the
top five contaminated rivers in the United States.
13. Lakewide, almost all contaminant concentrations have
decreased since 1971. In addition to the trend for metals (e.g.,
Hg), polychlorinated biphenyl (PCB) sediment concentra-
tions also decreased (from 136 ng/g to 43 ng/g). (Note: n is
nano or 10 .)
a.
Knowing that organic chemicals such as PCBs,
DDT,
and
Mirex, etc., can bioaccumulate in fish and other organisms,
would it now be safe to eat any type and size of fish caught
in the lake several times a week? Explain your reasoning.
b. Where would you seek information on eating fish from
Lake Erie (i.e., a fish advisory)? Give specific Web (URL
optional) or other sources you would check.
PART B. INDUSTRIAL WASTES IN THE
MAHONING RIVER, NORTHEASTERN OHIO
The Mahoning River drains the densely populated
and once highly industrialized Warren-Youngstown
area in northeastern Ohio. In reaches above Pricetown
(Figure 14.4) acid-mine drainage from coal mines
enters the river, resulting in high concentrations of sul-
fate, iron, and dissolved solids, and increased hard-
ness and low pH.
QUESTIONS 14, PART B
1. Use the following four maps, Table 14.4, and a color code to
distinguish the four water types given in Table 14.5 (type 1,
blue; type 2, yellow; type 3, green; type 4, red). Color the out-
lined area along the Mahoning River to indicate the range of
sulfate, chloride, pH, and temperature in the reach represented
by each sample collection site.
The data for each site in Table 14.3