Geology Reference
In-Depth Information
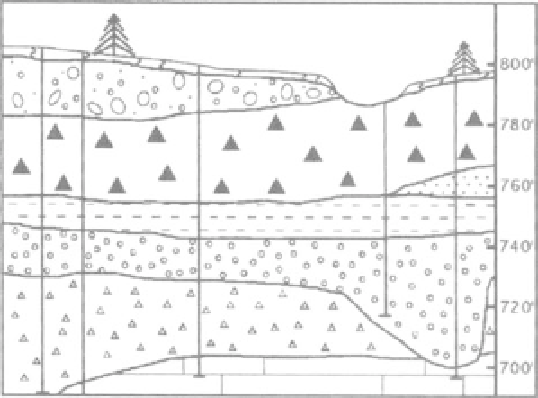
vertical lines in Figure 12.5). If a unit is encountered in
one well, but not in the next, the section must be
drawn to indicate that it has not been encountered in
the latter well. This is illustrated in Figure 12.5. Note
that the sand unit at 760 ft was only found in one well
on the right. Either it was not deposited elsewhere, or
it has been eroded.
PART B. SUBSURFACE GEOLOGY
In addition to looking at the flow of groundwater, it is
important to have a mental understanding of what the
distribution of subsurface geologic units may be like.
Different geological units will allow different amounts
of water to flow through them depending on their
hydraulic conductivity (Table 12.1). Understanding the
relationships among subsurface geologic units is very
important in developing an understanding of how
groundwater moves in complex subsurface environ-
ments. Although there is much difference in the geol-
ogy of subsurface units in different geological settings,
the example below illustrates how sedimentary units
might be related in many parts of the northern United
States where glaciation has modified or formed the
regolith.
When geologists begin to investigate the subsur-
face geology of an area, they often are limited to data
gathered from existing wells. These data are in the
form of well logs, which are a driller's or a geologist's
written records of the different types of rock materials
encountered as a well was drilled. By using logs from
one well, a graph can be drawn that shows units
encountered, as is illustrated in Figure 12.4. The
depths at which different geologic units are encoun-
tered are shown. Depths below ground surface often
are converted to elevations, so multiple wells can eas-
ily be plotted and compared. The transition from one
geologic unit to another is called a contact.
Data from multiple wells can be connected (cor-
related) to form a geologic cross section. A cross section
illustrates the subsurface relationships among differ-
ent geologic units.
Where data are available from multiple wells,
lines linking the geology in one well with the geology
in another well can be sketched between the wells.
Although there are no data between wells to suggest at
what depth a particular geological unit may be
encountered, it is reasonable to sketch a straight line
where units can reasonably be connected (wells are
QUESTIONS 12, PART B
Your assignment is to interpret the well logs in Table 12.2, draw
a topographic map, draw a geologic map, draw cross sections
that illustrate the subsurface geology, and answer related ques-
tions about how water may move in the subsurface. The distri-
bution of wells is shown on the map in Figure 12.6.
1.
List the five different types of sediment or rock found in
the wells (see Table 12.2).
2.
Which sediment has the highest hydraulic conductivity?
Which two have the lowest? (See Table 12.1 for hints.)
3. In Table 12.2, complete the data for
Depth
(to the bottom of
each unit) and
Elevation
(height above sea level for the bot-
tom of each unit) for wells 4-8. Wells 1-3 are completed in
the table as guides.
4.
On Figure 12.6, put the land elevation beside each well.
Draw topographic contours showing the configuration of
the land surface. Use a contour interval of 20 feet for your
topographic map.
The 260-foot contour is given on the map.
FIGURE 12.4
Typical log from a well, showing geologic materials
FIGURE 12.5
Geologic cross section, showing the correlation
and contacts.
(connection) of geologic units in the subsurface between wells.