Geology Reference
In-Depth Information
Most commonly the water table forms a gently
sloping surface that follows the land surface (i.e., higher
under hills than adjacent valleys). The water-pressure
surface in artesian systems also generally follows
topographic contours but in a more subdued manner.
When the water table is at or near the land surface,
groundwater may evaporate or be transpired by
plants in large quantities and thus returned to the
atmosphere.
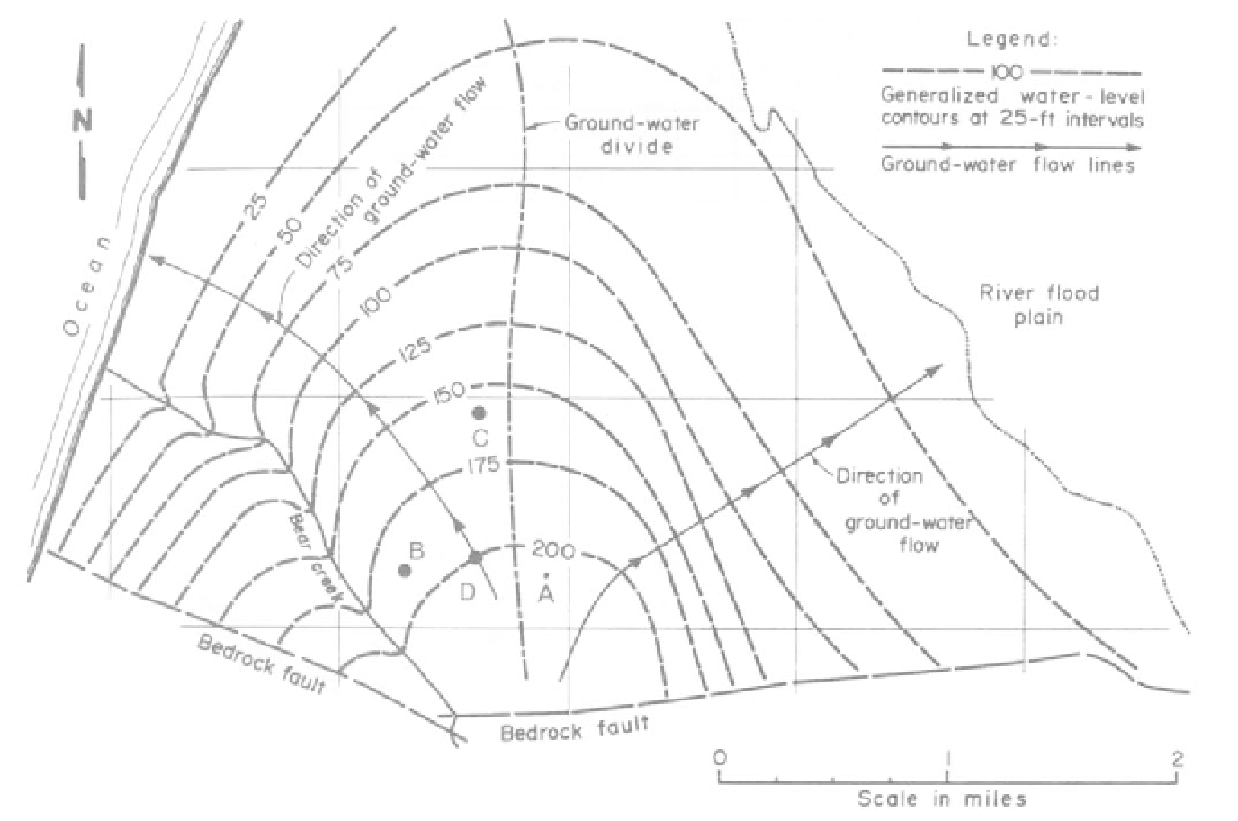
The water table or water-pressure surface con-
trols the direction of groundwater flow and can be
mapped in a manner similar to contouring surface
topography (Figure 12.3). In this case, however, con-
trol points are water elevations in wells, springs, lakes,
or streams. Groundwater flows in the direction of
decreasing head, which means that it flows from high
to low pressure in a groundwater system. The high-
pressure areas are where the water table is high or the
water-pressure surface has a high value. On the con-
tour map of the water table the flow lines cross the
contour lines at right or 90° angles; the flow of ground-
water effectively moves down slope or down gradient.
Note how the flow lines curve to maintain the 90°
crossing of each contour line in Figure 12.3.
The
hydraulic gradient (I)
is the difference in water
level per unit of distance in a given direction. It can be
measured directly from water-level maps in feet per
foot or feet per mile. It is the slope of the water table
surface or the water-pressure surface. (See "Slope or
Gradient" in Part B of Exercise 3).
By using water-level maps in conjunction with
topographic maps, the depth to the water table or
water-pressure surface can be determined. This depth
will vary with time depending on the season and the
amount of recharge supplied by precipitation infiltrat-
ing the aquifer and the amount of discharge by pump-
ing and by natural outflow to springs and streams. If
discharge exceeds the rate of recharge to the aquifer,
the water level in the aquifer will decline, and some
wells could become dry.
The rate of groundwater flow generally ranges
from 5 ft/day to 5 ft/year. It is usually less than 1 ft/day,
but velocities greater than 400 ft /day have been mea-
sured. Groundwater
velocity (v)
depends on
hydraulic
conductivity (K),
the hydraulic gradient (I), and the
effective porosity
(n
e
). Sometimes permeability (P) and
specific yield (fl) are used in place of hydraulic con-
ductivity and effective porosity, respectively. The
FIGURE 12.3
Water-level contour map showing elevation of the upper surface of the saturated zone (the water table). Groundwater
flows down-gradient at right angles to the contours, as shown by the two flow lines that have been added to the map.
One mile = 5,280 feet.
(Modified from Johnson, 1966, p. 40)