Geology Reference
In-Depth Information
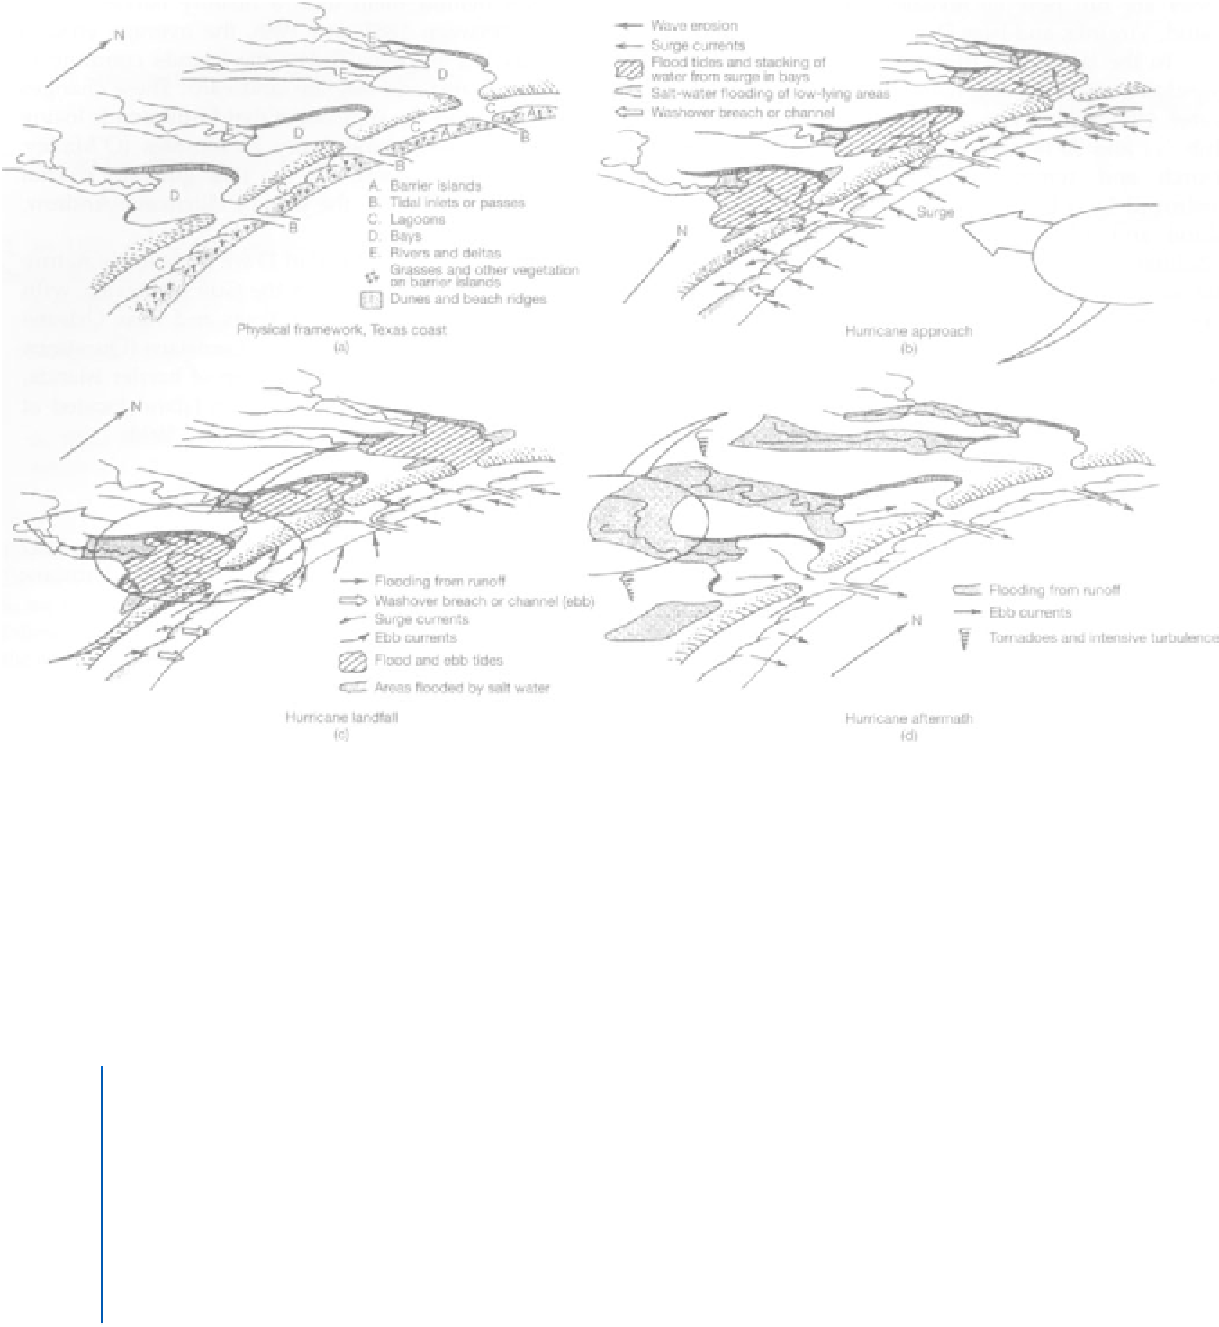
FIGURE 11.12
Impacts of a hurricane as it makes landfall. Figure (a) shows the morphology of the coast. Note that there are no
towns shown in this drawing. Figure (b) shows the approach of the storm. The greatest storm surge will be on the north side of the
storm in this drawing, as this is where the counterclockwise winds will pile up water the most. Figure (c) depicts landfall conditions.
Tremendous amounts of wave erosion continue along the coast, while south of the storm path (in this drawing) ebb currents push
water back out to sea. Any houses built along the barrier island, therefore, must be protected not only from waves that come from the
sea, but also from currents that flow to the sea from land. Figure (d) shows residual flooding and ebb currents.
(From McGowen et al, 1970)
TABLE 11.3 Saffir-Simpson Hurricane Scale (from
http://www.nhc.noaa.gov/aboutsshs.shtml
)
.
Storm Category
Wind Speed Range (in miles per hour)
Typical Storm Surge (in ft)
I
74-95
4-5
2
96-110
6-8
3
111-130
9-12
4
131-155
13-18
5
>155
>18
Barrier Islands
Barrier islands are elongate ridges consisting mainly of
sand that extend a few hundred meters to many kilo-
meters along a coast. They have a beach on the ocean
side and commonly are capped by sand dunes. Backed
by a lagoon, marsh, or tidal flat, these islands are sepa-
rated by inlets that probably formed during a storm in
a wash-over erosion event. Barrier islands are part of a
dynamic longshore transport system, migrating by
erosion and deposition in response to natural and
human factors. In response to changing sediment sup-
ply and sealevel rise, barrier islands retreat or decrease
in size as their sand is lost to the lagoon or into deeper
water offshore. Major changes occur during storm
surges that wash over much of an island, causing large
structural losses on heavily developed islands. Such