Geology Reference
In-Depth Information
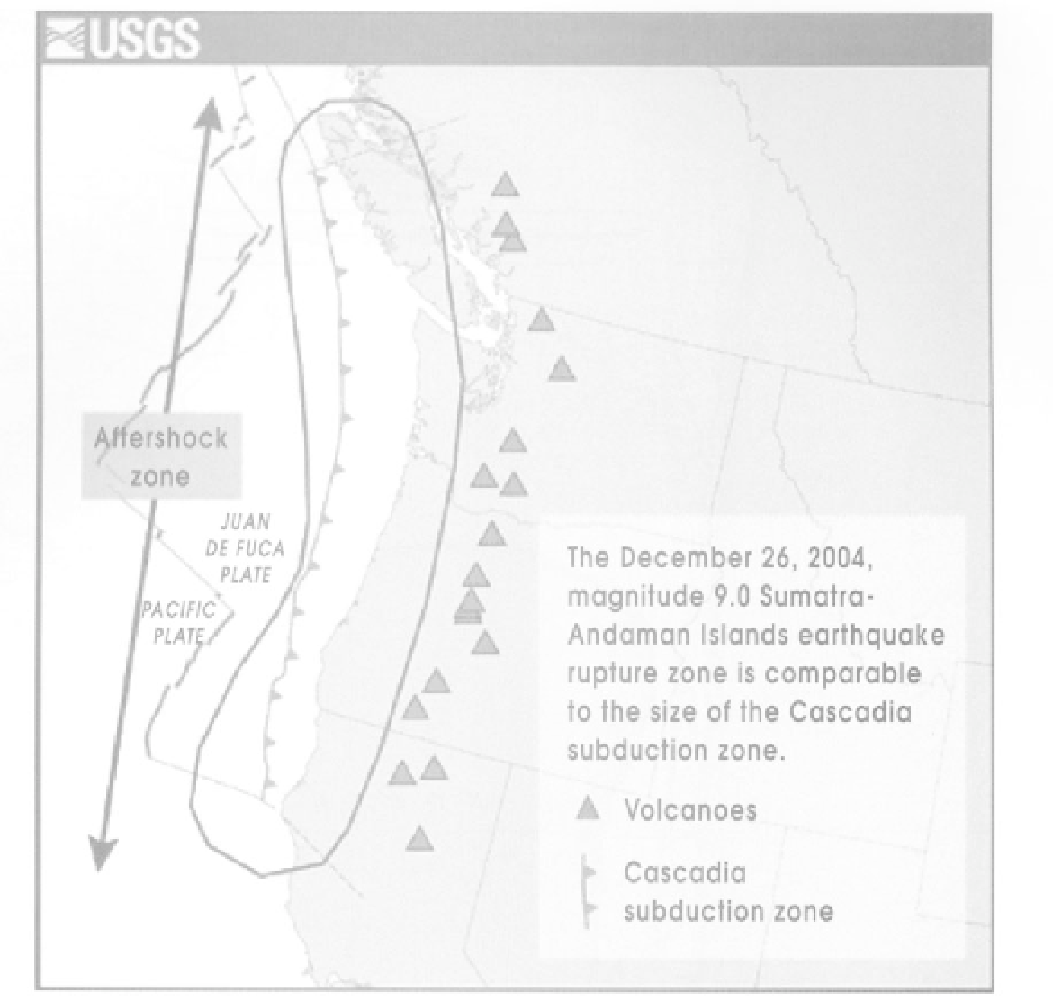
FIGURE 11.9
Sausage-shaped region depicts the rupture zone size of the Sumatra earthquake of December 2004, overlaid on a map
of the Pacific northwest. Aftershocks occurred throughout the entire rupture zone. (
http://soundwaves.usgs.gov/2005/03/cascadiaLG.gif
)
Ocean Shores, Washington, is a popular vacation
destination for people from the Tacoma-Seattle metro-
politan area. Its population of slightly more than 4,000
residents can increase ten-fold on busy summer week-
ends. Ocean Shores is proud of its designation as
"tsunami aware." It has signs that remind visitors of
tsunami hazards, and pamphlets and signs that illus-
trate tsunami escape routes. The tidal range in this
area can be more than 3 m (12 feet).
2. Based on these maps, has deposition or erosion been dom-
inant between 1915 and 1994 near Ocean Shores? Near West-
port? Explain your evidence.
3. What changes in land use have taken place between 1915
and 1994 in the area shown on these maps?
4. What is the highest elevation of land in Ocean Shores?
Westport?
QUESTIONS 11, PART C
Refer to Figures 11.10 and 11.11, which are two maps of the
Washington coast. Figure 11.10 is a 1915 map that shows the
Ocean Shores area, and Figure 11.11 shows the same area in
1994. The original maps were different scales, and they have
been reduced for use in this exercise.
5.
What do the changes in land use imply about the risks
from storm waves or tsunamis in this area?
1.
What changes have taken place between 1915 and 1994 in
the shape of the coast near Ocean Shores? It is especially
important to look in the area of the two jetties at the entrance
to Gray's Harbor.