Geology Reference
In-Depth Information
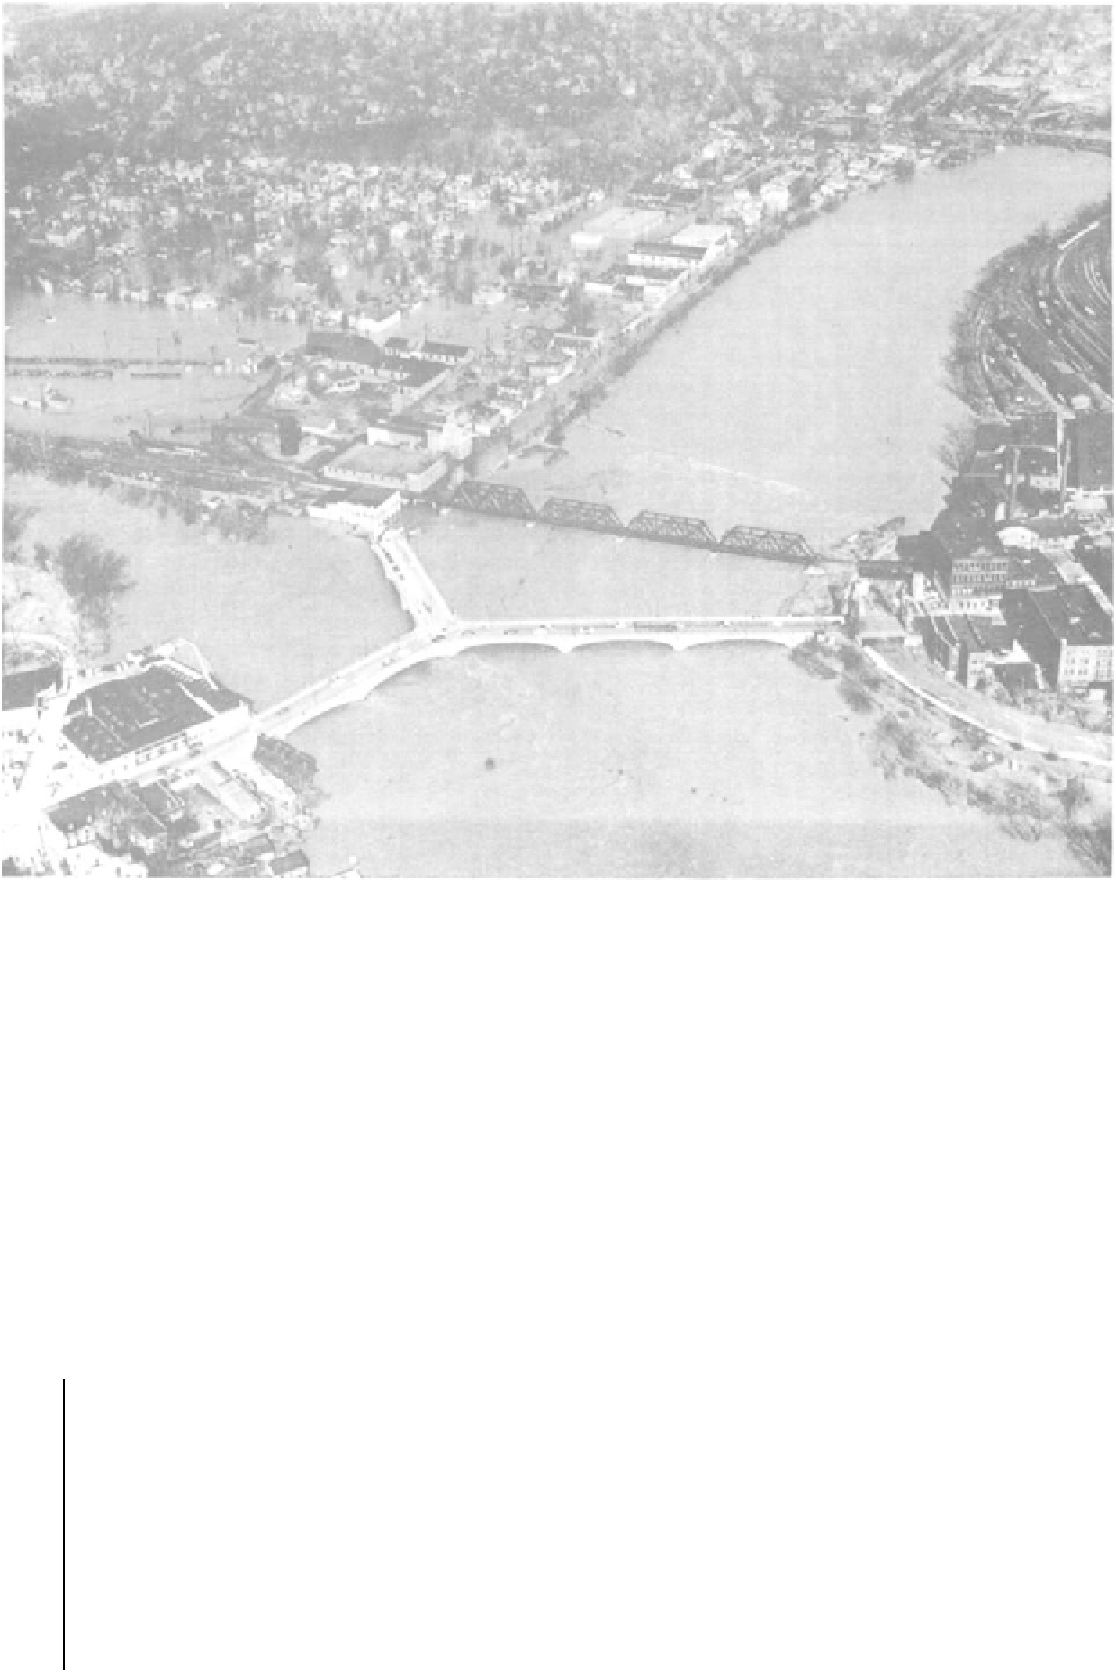
FIGURE 10.4
Confluence of Licking (left) and Muskingum (right) rivers at Zanesville during 1959 flood.
(USGS, from
the
Zanesville
Signal)
In this exercise we examine the extent, frequency,
and causes of some river floods, and ways to reduce
loss of life and property.
2. What are the expected elevations of the following floods at
the Dillon gaging station as determined from Figure 10.6?
a.
30 years:
QUESTIONS 10, PART B
1.
Using the data in Table 10.4 and the graph paper (Figure 10.6)
plot the data and draw a straight line for frequency of floods
at Dillon Falls, Ohio. Use a dashed line beyond the 40-year
recurrence interval.
b. 50 years:
c.
100 years:
TABLE 10.4 Recurrence Interval, Stage, and Discharge at Dillon Falls, Ohio
Recurrence Interval at the Gaging
Station (Yr)
Elevation Above Mean Sea Level,
Stage (ft)
Discharge (cfs)
=3
40
710.2
27,400
20
708.7
24,300
10
707.0
21,100
5
705.1
18,000
3
703.5
15,600
J*