Geology Reference
In-Depth Information
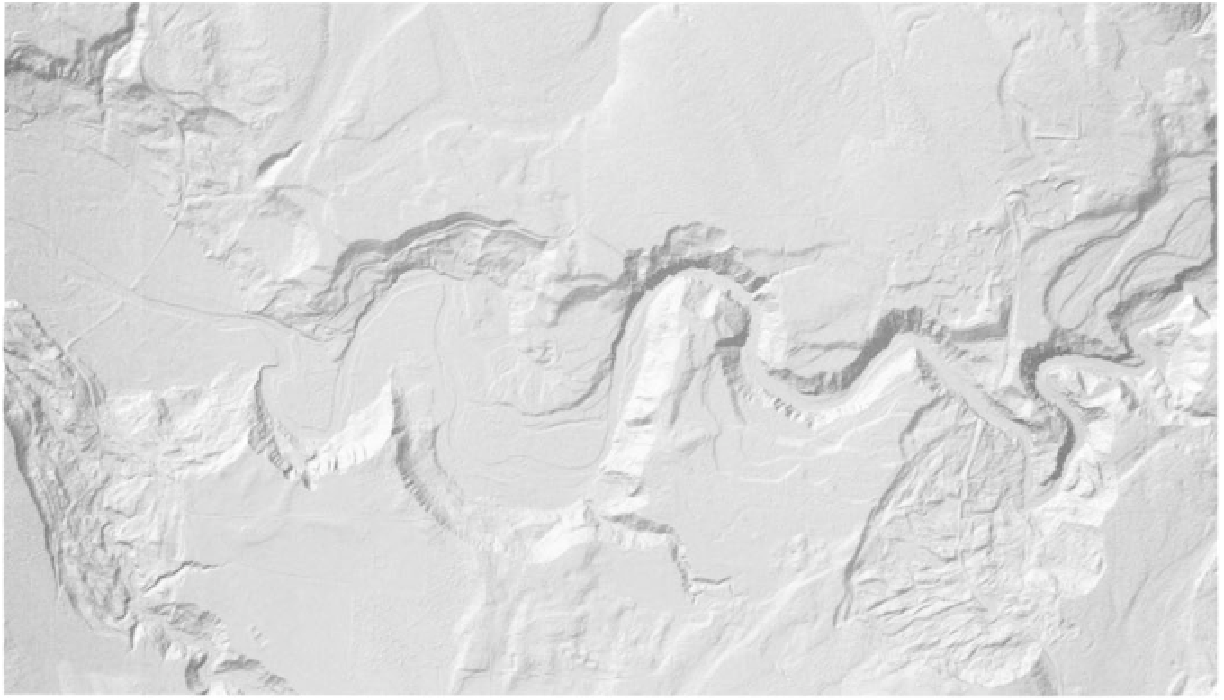
FIGURE 8.11
Green River Gorge Lidar Image. (Courtesy of King County, Washington, GIS Center)
PART B. LANDSLIDES IN SAN JOSE,
CALIFORNIA
b.
Explain why two different contour intervals were nec-
essary for each map.
Landslide deposits in the northeastern part of the city of
San Jose were first shown on a geologic map done by
Crittenden (1951). A subsequent map, based on inter-
pretation of aerial photographs and field investigations,
included many additional landslide deposits that are
shown as lighter areas with arrows (Figure
8
.12, Nilsen
and Brabb, 1972). Damage to urban structures within
part of the landslide-prone area is shown in Figure
8
.14.
The landslides, which may be continuously or intermit-
tently moving, or not moving at all, are primarily the
result of natural processes. Human activities may alter
these processes and even render some areas unstable. In
order to determine the stability of a particular site, a
landslide deposit map, such as Figure
8
.12, would be
used in conjunction with other information concerning
soils, vegetation, hydrology, and other geologic factors.
In general, fewer of these characteristics will be
noted in smaller deposits. Detailed site studies, of
course, are required for predicting the behavior of
landslide deposits under changing conditions.
2. Place an X in the area of the largest landslide deposit
within the enclosed area in the center of Figure 8.12. What is
the approximate area of this slide, in square miles?
3.
What materials make up the landslide deposit?
4.
The density of contour lines changes from the northeast
part of the map to the southwest part, indicating a change
from steep to gentle slopes and suggesting an increase in
potential for landslides. What is the difference in elevation
between A and B?
5. What is the distance from A to B in miles?
6. What is the average gradient (slope), in feet per mile, from
A to B?
QUESTIONS (8, PART B)
1.
Review Part A, carefully examine Figure 8.12, the explana-
tion for this figure, and the topographic map for this area
(Figure 8.13 in the map section at the back of the topic). Note
that two different contour intervals are used on each map.
a.
What are these contour intervals?