Geology Reference
In-Depth Information
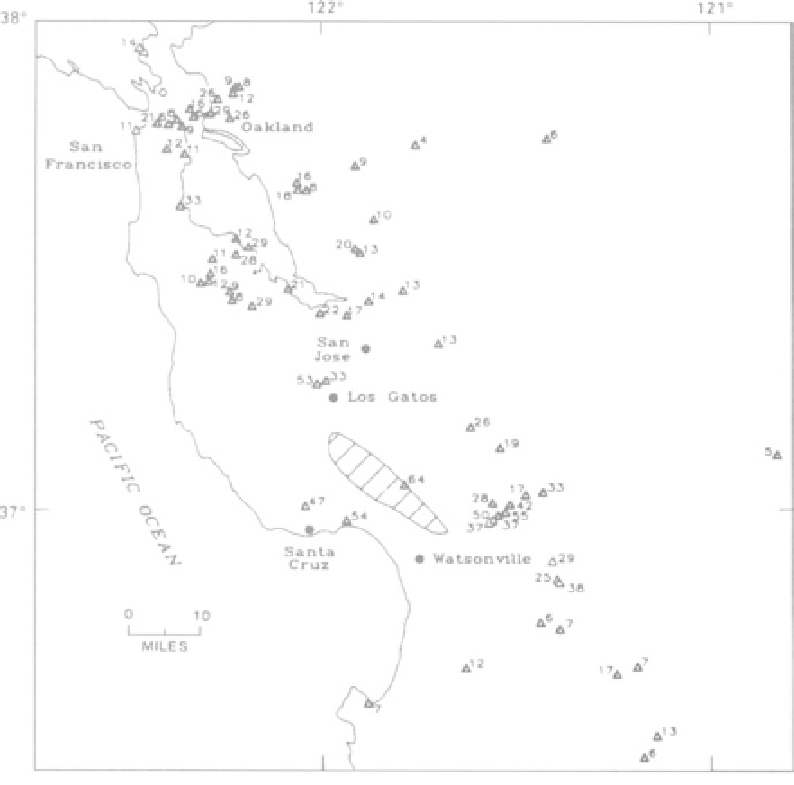
FIGURE 7.4
Horizontal acceleration as a percent of gravity (980 cm/sec/sec) at measured sites for the
Loma Prieta earthquake. The lined region is the epicentral area (Pflaker and Galloway, 1989).
PART B. GEOLOGY AND SEISMIC
IMPACTS: SAN FRANCISCO BAY
AND MARINA DISTRICT
San Francisco Bay Region (7, Part B1)
2.
Compare Figure 7.6 with Figure 7.8.
a.
What geologic conditions (materials and setting) led to
the maximum intensities during the 1906 earthquake?
Figures 7.6 (geologic map), 7.7 (maximum predicted
intensity), and 7.8 (1906 apparent intensity) show dif-
ferent factors of the geology and the expected and
actual impacts of earthquakes in the San Francisco Bay
region. The regional setting for these maps is shown
on Figure 2.17, the satellite image on the back cover of
this topic.
b. What geologic conditions led to the minimum intensities
during the 1906 earthquake?
3.
a.
Using data from all three maps, determine typical geo-
logic conditions that are likely to create areas with maximum
seismic impacts. Explain these conditions below.
QUESTIONS (7, PART B1)
b. Using data from all three maps, determine typical geo-
logic conditions that are likely to create areas with mini-
mum seismic impacts. Explain these conditions below.
Read and compare the maps in Figures 7.6, 7.7, and 7.8 to
answer the following questions.
1.
a.
What two geologic units in San Francisco and Oakland
have the maximum predicted intensities for earthquakes?
b. What are the geologic conditions that have lead these
areas to have high predicted maximum intensities?
The Marina District (7, Part B2)
Impressive photographs and videos were made of
damage from the Loma Prieta earthquake in the
Marina District in northern San Francisco. This was an
area of extensive collapsed and damaged buildings