Geology Reference
In-Depth Information
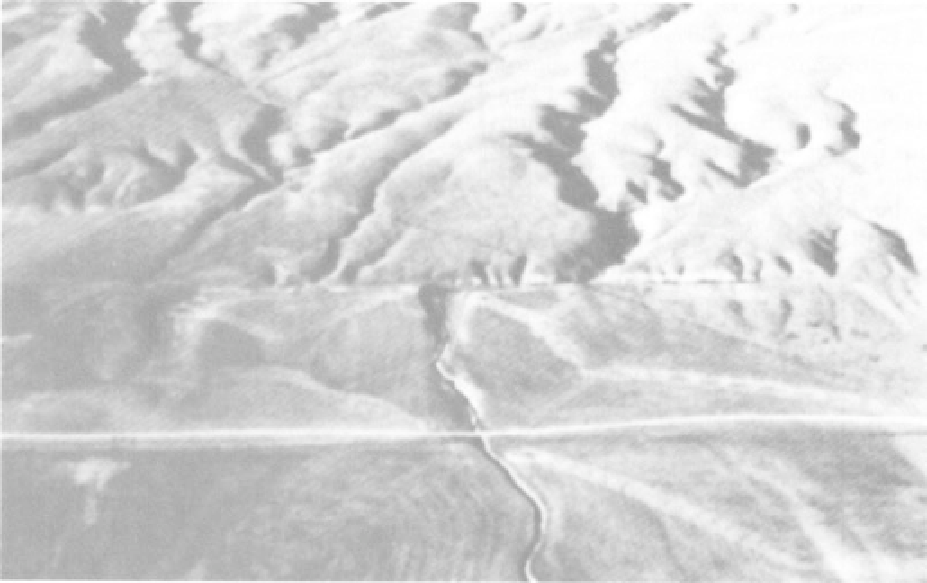
FIGURE 6.9
Aerial photograph of the San Andreas Fault in the Carrizo Plain at Wallace Creek, California. The fault runs horizontally
across the middle of the photograph; the horizontal white line in the lower part of the photograph is a road. Agricultural features on
the photo include fences and crop harvest patterns (Wallace, 1990).
Figure 2.17, on the back cover of this topic, is a satellite
image of the San Francisco Bay area. The yellow dots on this
image are earthquake epicenters. Use this figure to answer
the following questions.
Different geologic and land use patterns are distinctive
on the image. Areas with large shadows indicate high topog-
raphy (mountains). Linear alignments of valleys, rivers,
lakes, or mountains may indicate a fault zone. Flat, dark
areas may be lakes, reservoirs, or the ocean. Mottled gray
patterns, with very small rectangles, are urban areas, broken
into blocks and dissected by rivers and freeways. Larger rec-
tangular patterns can represent agricultural fields. Rivers
often have winding patterns through mountain, agricultural,
and urban areas.
8.
Which features of strike-slip faults shown of Figure 6.7 can
be seen easily on the satellite image? Why are some features
easier than other features to see on the image?
11.
What evidence of faults do you see on the radar image?
9.
How do the locations of earthquake epicenters help you
determine geographic features that are related to faults?
12.
Draw on the image all the fault traces you can find.
10.
Mark on the back cover (Figure 2.17) or on a tracing such
as Figure 2.18, the traces of several major faults in this area.
13.
Use the Web, or material provided by the instructor, to
label faults including the Elsinore and San Andreas on
Figure 6.10.
Study the radar image of southern California in Figure
6.10. This image was made from an airplane that bounced
radar waves off the earth. The radar is able to penetrate veg-
etation and clouds, so the image is very clear. The surface of
the land is shown as if the sun lighted it, with bright slopes
facing the sun and dark areas of shadow. Of course, in a
radar image it is not sunlight but is the location of the air-
plane sending out the radar that creates the bright and
shadow areas.
14.
Find and label an example of the following: agriculture
pattern (A), urban region (U), major highway (H), lake (L),
and river (R).