Biomedical Engineering Reference
In-Depth Information
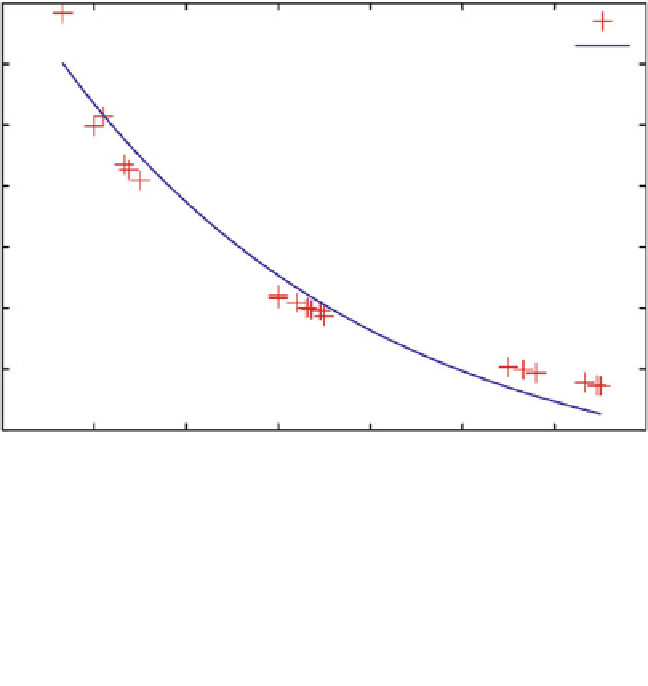
BioSpi model of rolling cells percentage
16
BioSpi predicted values
Fitting curve
14
Fit function:
12
f(x) = A exp(-x/B)
10
A = 23 +/-1
B = 34 +/-2
8
6
4
2
10
20
30
40 50
Vessel diameter (micrometers)
60
70
80
Fig. 4
Rolling cells percentage versus vessel diameter in BioSpi model
laminar flux on the endothelium as the ratio between the endothelial surface and
the cell contact area (
200 m
2
for a cell of about 10 m of diameter), we express
the rolling cells percentage (RCP) as in (
1
).
S
contact
S
endothelium
C
C
2
RCP
/
Pr.
rolling
/
C
1
N
(1)
where
Pr
.
rolling
/ is the rolling propensity, N is the number of bound molecules and
the C 's are proportionality constants depending on physical-chemical properties of
the cell interaction with endothelium (overall intensity of the bond force and the rate
of kinetic energy loss because of the intra- and extra-cellular frictions) and from the
duration of the contact time with the endothelium [
9
,
11
,
15
,
18
,
22
,
32
]. In our model
C
1
D
1 and C
2
D
0.
The value of RCP shown in the plot of Fig.
4
is obtained by getting from each
simulation the value of N at the fixed time t
D
15 s and substituting it in (
1
).
Figure
5
shows the experimental value of the RCP versus cells diameters. Either in
the simulated case or in the experimental one, the best fit has the same functional
form of (
2
) and the fit parameters have values in overlapped error ranges.
D
a exp
D
v
b
RCP
(2)