Biomedical Engineering Reference
In-Depth Information
PSGL-1/P-SELECTIN INTERACTION
ALPHA4/VCAM-1 INTERACTION
100
80
60
40
20
0
2
1.5
1
0.5
0
0
2
4 6
Time (sec)
8
10
0
2
4 6
Time (sec)
8
10
CHEMOKINES/RECEPTORS INTERACTION
LFA-1/lCAM-1 INTERACTION
250
200
150
100
50
0
100
80
60
40
20
0
0
2
4 6
Time (sec)
8
10
0
2
4 6
Time (sec)
8
10
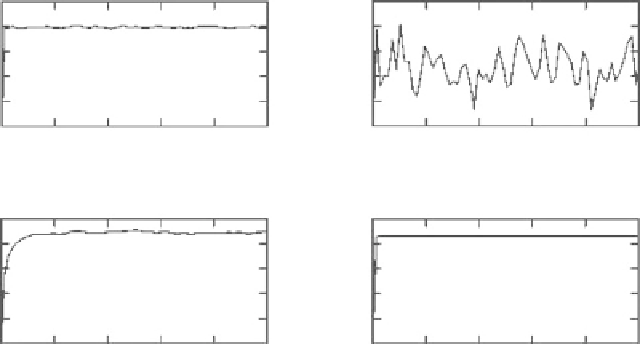
Fig. 2
BioSpi simulation of 4-phases model of lymphocyte recruitment
The BioSpi simulations reproduce the hyperbolic behavior predicted by the
Dembo model. However unlike Dembo model, the BioSpi model is more sensitive
to the variations of the dissociation constant rate k
off
.
In Fig.
2
the curve describing the time-evolution of the bonds number of LFA-
1/ICAM-1 interaction presents an approximately linear steep increasing followed by
a clearly constant behavior: this curve represents the firm adhesion of lymphocyte
and it is comparable with the state diagram of the mechanical model shown in
Fig.
7
. In fact, the firm arrest is reached when the number of bonds become stably
constant in the time or, analogously, when the position of cell centroid does not
change anymore. On the contrary, the plots representing PSGL-1/P-SELECTIN
and ALPHA4/VCAM-1 interactions present, after a steep increasing with about the
same slope of that of LFA-1/ICAM-1 binding, an oscillating behavior respect to the
equilibrium positions given by the y
D
80 and y
D
1, respectively. This behavior
represents the sequential bonds breaking and formation in the selectins and integrins
binding during the rolling (see Fig.
7
for comparison).
4.1
BioSpi Prediction of Rolling Cells Percentage
as a Function of Vessel Diameter
We have repeated the BioSpi simulation of lymphocyte recruitment for three groups
of different values of the vessel diameter D
v
(i. e., for different volumes V of the
space in which the chemical interactions occur) given in Table
5
. The result is the
set of three groups of curves shown in Fig.
3
.