Biomedical Engineering Reference
In-Depth Information
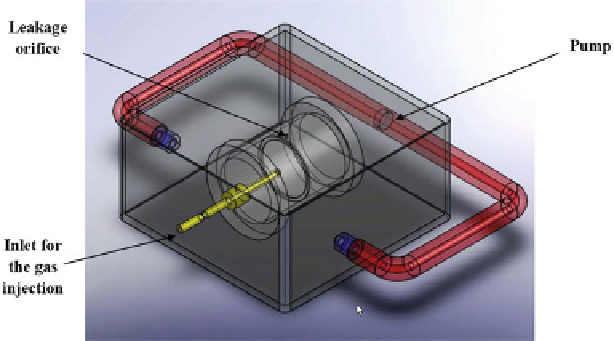
Fig. 15
Computer model used for the CFD analysis
5.1
Case 1: a 1 mm Hole
The analysis of the response time took in consideration the time that each curve
would take to start increasing in a constant angle. Figure
16
shows that the physical
experiment takes 5 s more to start increasing than the computational one. At the
beginning of the experiment the curves would differ by around 12% and after 180 s
the values are differing by around 4%. There is a similarity between the slopes of
the curves for the first 55 s but after this period there is considerable variation in the
curve up to approximately 140 s. Simulations with different meshes and step times
were performed to identify the reason for this result, but all of them would show a
similar behaviour very close to this same interval. One of the possible explanations
for this result is that the simulation in FloWorks does not appear to break up the
period of simulation evenly [
10
]. It appears that FloWorks uses different step sizes
for the iterations to calculate the results, and as these step sizes cannot be fixed, this
was leading to the unexpected results.
5.2
Case 2: a 2 mm Hole
The response time in this case is faster than case 1 for the physical experiment due to
the fact that the area of the hole now is bigger allowing more gas to exit the hole in a
shorter time. Figure
17
shows a similar behaviour to that of the previous experiment.
Again simulations with different meshes and step times were performed to see if any
changes would result, but all of them would show a similar behaviour very close to
this same interval (Fig.
18
).