Biomedical Engineering Reference
In-Depth Information
0 degree
90 degree
1100
1000
900
800
700
600
500
1100
1000
900
800
700
600
500
400
300
200
100
0
0 degree 1
90 degree 1
90 degree 2
90 degree 3
0 degree 2
0 degree 3
400
300
200
100
0
0 0 0
time [s]
60
80
100
0 0 0
time [s]
60
80
100
180 degree
270 degree
1100
1000
900
800
700
600
500
400
300
200
100
0
1100
1000
900
800
700
600
500
400
300
200
100
0
180 degree 1
270 degree 1
270 degree 2
180 degree 2
270 degree 3
180 degree 3
0 0 0
time [s]
60
80
100
0 0 0
time [s]
60
80
100
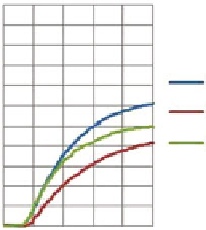
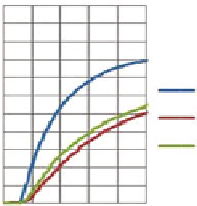
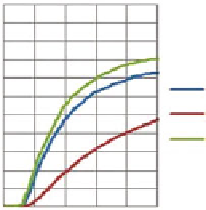
Fig. 6
An effect of the inaccurate positioning of the leak hole and the bad sealing is shown by the
high variation of the results
result of 640 ppm close to the result for the blue curve in the 270
ı
plot, 620 ppm
whilst they should be giving higher reading of gas concentration than the 0
ı
position
because they are closer to the testing ring outlet. Again, a plausible reason is the
irregular sealing of the system occasioning these readings of ppm increase over the
time.
Because of these problems it became obvious that the testing ring needed to
be modified. The first idea was to find a different way of blocking the path in the
groove, but no successful design could be found. Then, the idea of modelling another
testing ring using two sensors was investigated. Using two sensors would eliminate
the need for a separator and also enhance the accuracy of the detection of the leakage
spot. This second prototype of testing ring was modelled in Solid Works and then
rapid prototyped as before. The second model is shown in Fig.
7
.
The small holes around the circumference of the sensing ring are used to fix it to
the stand to avoid any changes in its position while the rigid tube is inserted into it.
They are also used as a reference for the different angles of rotation. These holes are
at 10
ı
intervals to allow for repeatable repositioning of the sensor ring with respect
to the “colon”.