Biomedical Engineering Reference
In-Depth Information
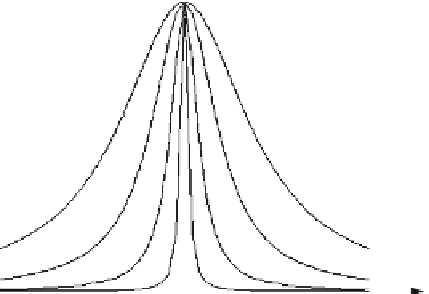
Fig. 3
Family of curves from
the diffusion coefficient as a
function of k (
8
)
D
k=10.0
k=5.0
k=2.0
k=0.5
2.3.1
Improved Coefficient of Diffusion
While the formulation for the coefficient of diffusion (
3
) seems to be a good choice
to preserve the location of edges, as stated in [
28
], it does not specifically address
our need to preserve the variation of intensity across the edge and features of the
image within the tissue, which might be improved following the lines of [
6
].
By definition, edges are located in between two areas of perceived distinct in-
tensity levels within the image. Additionally, the OCT background is characterized
by a low average intensity level. Conversely, the tissue due to the differences in the
refractive index, presents a higher average level in the image.
We intend to manipulate (
3
) to take advantage of these facts. In this way, we aim
to facilitate diffusion at lower intensity level areas (e.g., vitreous, cysts, fluid-filled
regions) and to be conservative within the retinal tissue areas (preserving important
details for analysis). As an advantageous byproduct, edges are better preserved as
diffusion is decreased at the higher level side of the edge.
To this end, we need to locally modify k according to data, increasing k at low
level areas and making it smaller at higher level areas. This is a clear distinction to
the formulation using (
3
)wherek is made constant for the entire image and over
iterations. We proposed to adapt k locally by the use of the function
k
Max
C
k
Min
k
Max
min.g/
max.g/
g
k
D
min.g/
,
(10)
where min(g) and max(g) stand for the minimum and maximum of g, respectively,
with g being defined as
g
D
G
N;
Re.I /,
(11)
where
is the convolution operator and G
N;
is a local average (gaussian) kernel of
size N
N or N
N
N (depending on whether the approach is 2D or 3D) and
standard deviation .