Biomedical Engineering Reference
In-Depth Information
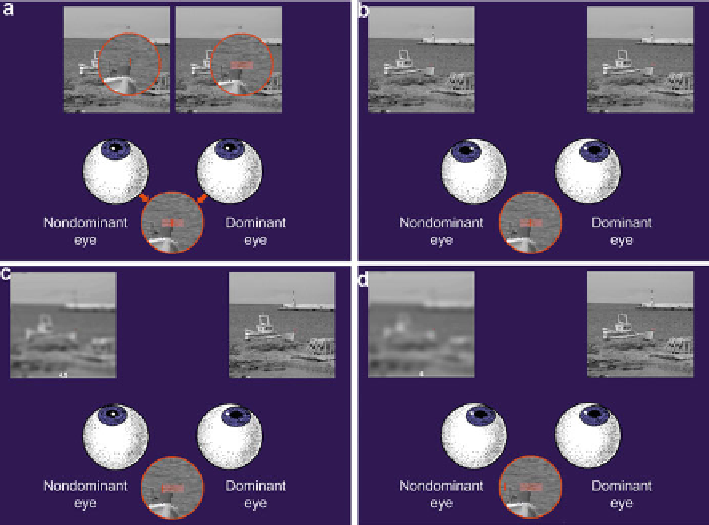
Fig. 21
Scheme of the measuring process with indicator box. (
a
) start position of the experiment
nondegraded images in the same position(
b
) first process moving of the nondegraded images to
the vergence load (both eye must fixate image - goes to squint) (
c
) in the maximal fixation position
given by step b the degradation of the image on nondomimant eye is applied (
d
) when the red line
is observed outside box the patient's fusion is disturbed and nondominat eye goes to the undefined
position
relative divergence burdens of 2.5, 5.0, 7.5, 10.0 and 12.5
BN (nasal). The relative
vergence burden started at zero and increased by 2.5
for convergence and 1.25
for divergence. The image speed was 0.33 fps (i.e. image changed after 3 s). Whole
process clearly illustrates Fig.
21
. For the speed of the growth in the forced vergence
and for zeroing it before another measurement there could not have been adaptation
to this burden and this was thus labelled as unadaptable.
Four people underwent the experiment ranging in age from 16 to 32. All were
orthotropic with exophorie 0-4
BT, without any other clinically detectable
deviations from normal binocularity. The central visual acuity of all eyes was 1.0.
Statistical analysis was made by Student's t-test.
The average threshold value for the degradation of a one-sided image (in the FCT
scale) necessary for the dichoptic masking effect for individual values of forced
relative vergence is given in Fig.
22
. It is clear that with increasing unadaptable
burden a lesser degree of degradation of the one-sided image is necessary for its
suppression. This trend is roughly three times more distinct during a burden on
relative divergence.