Graphics Programs Reference
In-Depth Information
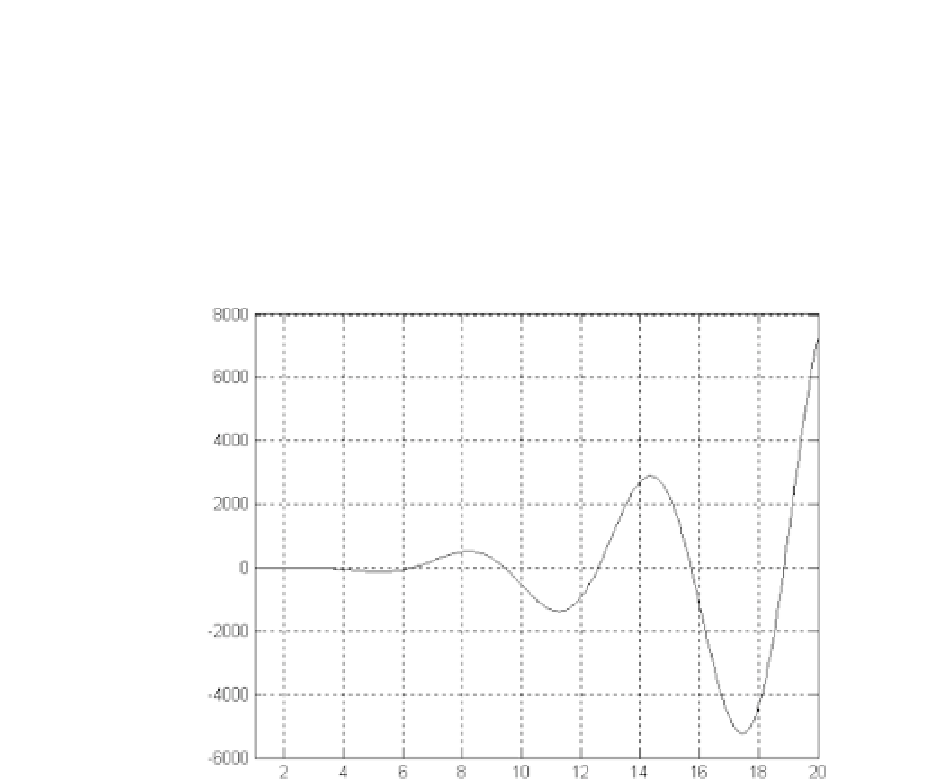
A function storedinaM-file can be plottedwith a single command, as shown
below.
functiony=testfunc(x)
%Storedfunction
y = (x.ˆ3).*sin(x) - 1./x;
>>fplot(@testfunc,[120]) %Plotfromx=1to20
>> grid on
The plots appearing in this topic from hereonwere not producedbyMATLAB.
We used the copy/paste operation to transfer the numerical data to a spreadsheet
and then let the spreadsheet create the plot. This resultedinplots moresuited for
publication.
Search WWH ::

Custom Search