Graphics Programs Reference
In-Depth Information
y'
(
x
)
Error
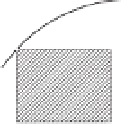
Figure 7.1.
Graphical representation of Euler'sformula.
Euler's formula
f
(
x,y
)
x
x
x
+
h
Let us now take a look at the graphical interpretation of Euler'sformula. For the
sake of simplicity, we assumethat there is a single dependent variable
y
,sothat the dif-
ferentialequationis
y
=
f
(
x
,
y
). The change in the solution
y
between
x
and
x
+
h
is
x
+
h
x
+
h
y
dx
y
(
x
+
h
)
−
y
(
h
)
=
=
f
(
x
,
y
)
dx
x
x
which is the area of the panel under the
y
(
x
) plot, shown in Fig. 7.1. Euler'sformula
approximates this areabythe area of the cross-hatchedrectangle. The areabetween
the rectangle and the plot represents the truncation error. Clearly, the truncation
erroris proportional to the slope of the plot; that is, proportionalto
y
(
x
).
Second-Order Runge-Kutta Method
To arrive at the second-ordermethod, we assume an integration formula of the form
c
1
F
x
y
)
h
y
(
x
+
h
)
=
y
(
x
)
+
c
0
F
(
x
,
y
)
h
+
+
ph
,
y
+
qh
F
(
x
,
(a)
and attempttofind the parameters
c
0
,
c
1
,
p
and
q
by matching Eq. (a) to the Taylor
series
1
2!
y
(
x
)
h
2
y
(
x
)
h
(
h
3
)
y
(
x
+
h
)
=
y
(
x
)
+
+
+
O
1
2
F
(
x
y
)
h
2
(
h
3
)
=
y
(
x
)
+
F
(
x
,
y
)
h
+
,
+
O
(b)
Noting that
n
n
∂
F
∂
F
∂
F
∂
F
F
(
x
y
i
y
i
,
y
)
=
x
+
=
x
+
y
i
F
i
(
x
,
y
)
∂
∂
∂
∂
i
=
1
i
=
1
where
n
is the number of first-order equations, wecan write Eq. (b) as
y
)
h
2
n
1
2
∂
F
∂
F
(
h
3
)
y
(
x
+
h
)
=
y
(
x
)
+
F
(
x
,
y
)
h
+
x
+
y
i
F
i
(
x
,
+
O
(c)
∂
∂
i
=
1
Returning to Eq. (a), wecan rewrite the last term by applying a Taylor series in
several variables:
F
x
y
)
=
n
+
∂
∂
F
F
(
h
2
)
+
ph
,
y
+
qh
F
(
x
,
F
(
x
,
y
)
x
ph
+
qh
y
i
F
i
(
x
,
y
)
+
O
∂
∂
i
=
1


Search WWH ::

Custom Search