Environmental Engineering Reference
In-Depth Information
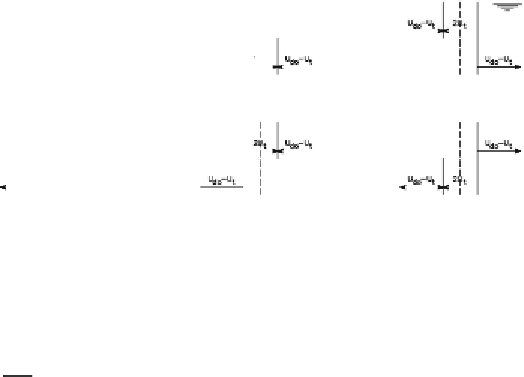
Fig. 3
Schematized flow profiles indicating reduction of density-induced exchange flow by
tidal filling or emptying of basin. Source: [28]. Reproduced with permission
with
u
do
=
f
3
∆
ρ
ρ
gh
1
/
2
(10)
where:
Q
d
=exchangerateduetodensitycurrents,
u
do
=exchangevelocity
without influence of tidal in- and outflow,
ρ
=densityofwater,
∆
ρ
=char-
acteristic density difference, (..)
1
/
2
= characteristic parameter of density cur-
rents,
f
3
=coefficient,
g
= gravitational constant (9.8 m
s
2
).
Figure 4 demonstrates the mutual relationships of a number of relevant
parameters, such as the water level variation at the harbor entrance (
h
), the
related river flow in front of it (
u
o
), the mean density variations outside (
/
ρ
0
)
and inside the harbor (
ρ
ha
) and their difference, as also the tidal in- and out-
flow currents (
u
t
)andtheundisturbedandeffectivedensitycurrents(
u
do
and
u
t
respectively) in case of harmonic relations. The lower figure distinctly in-
dicates the reduction of the water by density currents due to the tidal flow
velocities through the harbor entrance and the relevance of the phase lag
ϕ
t
and the ratio
u
do
/
u
t
in this respect.
Assuming linear harmonic relationships, the density induced exchange
flow rate can be integrated over a tidal cycle, which yields:
V
d
=
f
4
h
o
b
∆
ρ
max
ρ
gh
o
1
/
2
T
-
f
5
V
t
(11)
with for practical reasons:
max
=0.5
ρ
o,max
-
ρ
o,min
∆
ρ
(12)
and
V
do
=
f
4,max
h
o
b
∆
ρ
max
ρ
gh
o
1
/
2
T
(13)