Geoscience Reference
In-Depth Information
> 5.00 m
3.00 m - 5.00 m
2.00 m - 3.00 m
1.00 m - 2.00 m
0.50 m - 1.00 m
0.25 m - 0.50 m
-0.25 m - 0.25 m
-0.50 m - -0.25 m
-1.00 m - -0.50 m
-2.00 m - -1.00 m
-3.00 m - -2.00 m
-5.00 m - -3.00 m
< -5.00 m
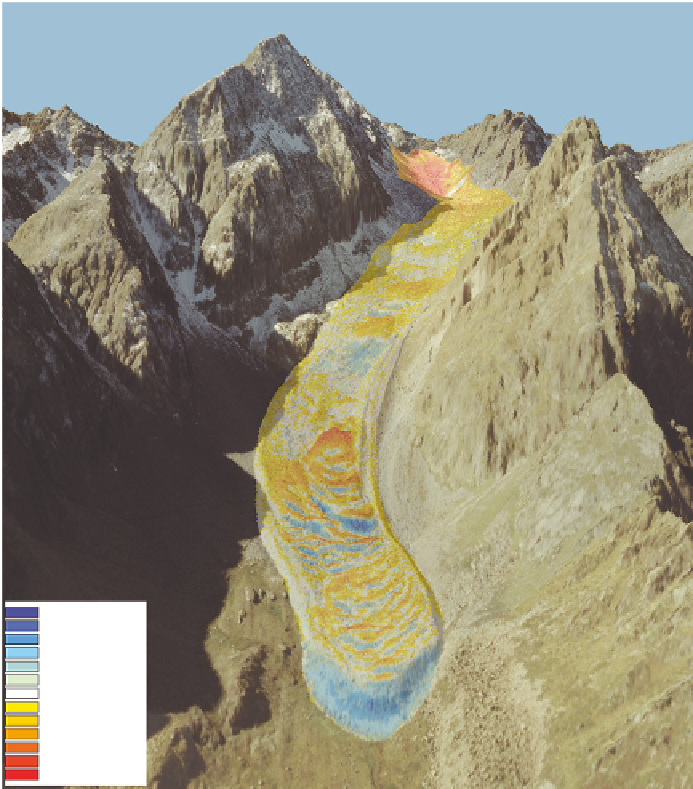
Figure 3.3.
Surface elevation change of Reichenkar rock glacier (Austrian Alps), derived from
multi-temporal airborne laser scanner data. Blue indicates positive elevation changes, white a
'stable' surface and yellow to red colours indicate negative elevation changes. Note: The area
with blue colours are indicating horizontal motion, elaboration by the authors.

Search WWH ::

Custom Search