Geoscience Reference
In-Depth Information
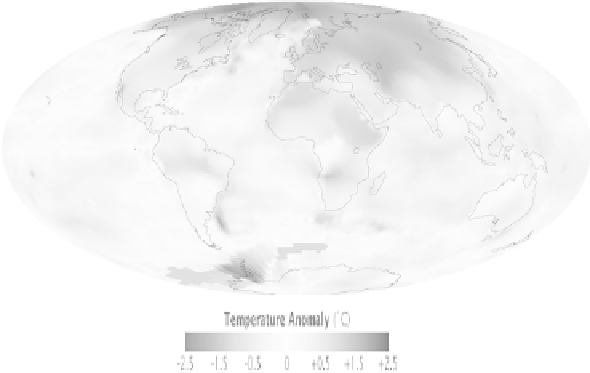
Temperature Anomaly (ºC)
-2.5
-1.5
-0.5
0
+0.5
+1.5
+2.5
Figure 18.2.
Source: NASA Earth Observatory Image of the Day (http://earthobservatory.
nasa.gov/IOTD/view.php?id=42392).
This general increase was primarily infl uenced by the winter temperature
which also contributed signifi cantly to the inter-annual variability of the
annual temperature.
Climate change over North America
Figure 18.3 shows projected surface annual mean temperature increases for
fi ve different regions in North America (IPCC-AR4 2007) by 21 AOGCMs
(Atmosphere-Ocean General Circulation Models) relative to the base period
of 1901 to 1950. Black lines indicate averaged observed temperature from
1906 to 2005, while the red envelopes indicate the spread of simulated
results by the climate models. Projections from 2001 to 2100 by the models
are shown by the orange envelopes for the A1B emission scenario (one of
the A1 scenarios describing a very rapid economic growth, with a rapid
introduction of new and effi cient technologies, and the global population
peaking in mid-21st century and declining thereafter). The three vertical
bars at the end of the orange envelope denote projected average changes
for the period 2091-2100 for different emission scenarios, including the A1B
(orange). For the western North American region (WNA), the projected
temperature increase ranges from around 2ºC to nearly 8ºC, depending on
the model and the emission scenario. Norgues-Bravo et al. (2007) suggested
that a mountainous region will likely experience a projected temperature
increase of 2 to 3 times greater than that observed during the 20th century.
The projected warming in the mountainous regions could be larger in

Search WWH ::

Custom Search