Geography Reference
In-Depth Information
80
°
100
°
120
°
140
°
140
°
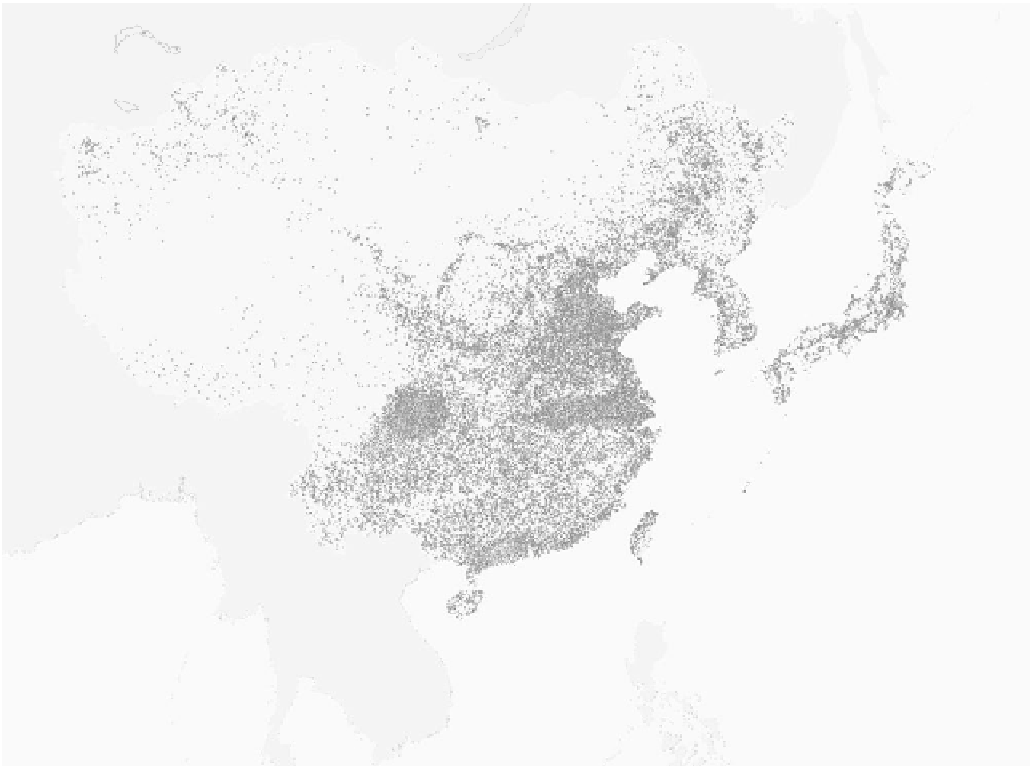
EAST ASIA POPULATION
DISTRIBUTION: 2010
One dot represents 75,000 persons
1200 Kilometers
0
0
600
300
600 Miles
100
°
Longitude East of Greenwich
120
°
Figure 11-18
Population distribution. What is the relationship between lowland regions and settlement.
Which half of the country do most people live in and why is this the case?
From H. J. de Blij
and P . O. Muller,
Geography: Realms, Regions and Concepts,
14th edition, 2010, p. 458. Originally
rendered in color. Reprinted with permission of John Wiley & Sons, Inc.
risen to 51 percent. T Two processes contributed to urban-
ization. First, a rural area, because of changes such as ru-
ral industrialization and intensified interaction with
cities, may be redefined as an urban area, thus boosting
the size of the urban population. Second, rural-urban
migrants directly add to the size of the urban population.
Both have happened in China and will continue to ele-
vate the level of urbanization.
Population mobility in China is significantly lower
than that in most Western economies. However, the 2000
census documents that mobility has increased signifi-
cantly . Inter-provincial migration surged in volume from
11.53 million for the 1985-1990 period to 33.24 million
in the 1995-2000 period. More than 60 percent of inter-
provincial migrants in the latter period originated from
inland provinces and moved to coastal provinces, thus
exacerbating the unevenness in regional population dis-
tribution. Areas with rapid economic growth, such as
Beijing, Shanghai, and Guangdong, are especially attrac-
tive destinations of migration. The 12 coastal provinces
account for less than 14 percent of the country' s land
area and more than 42 percent of its population. Their


Search WWH ::

Custom Search