Geography Reference
In-Depth Information
120
°
130
°
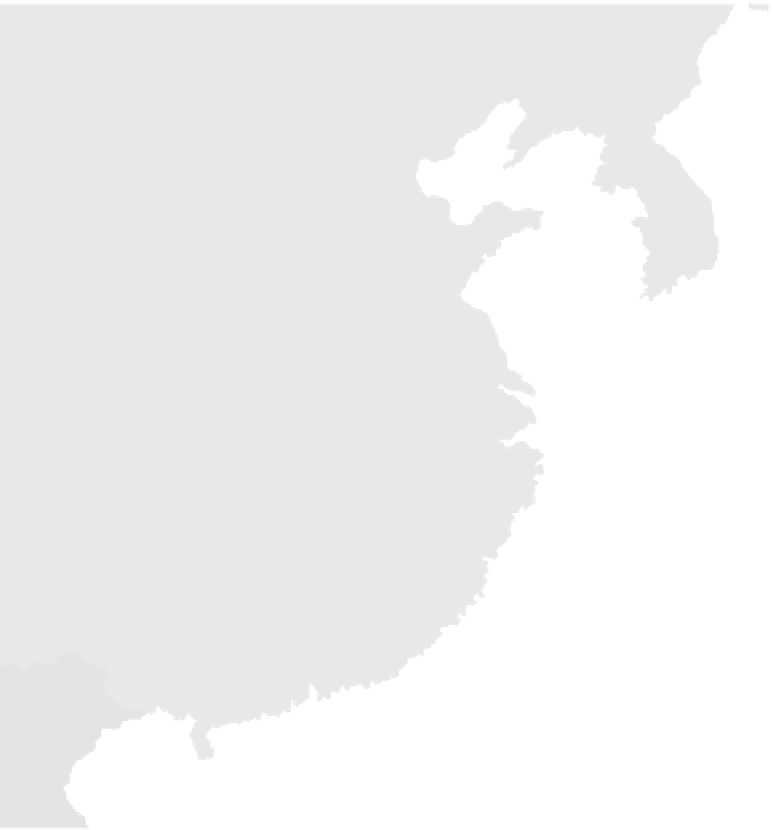
CHINA'S ECONOMIC ZONES
NEI MONGOL
A.R.
Special Economic Zones (SEZs)
Pacific Rim province
Open Cities
HEBEI
SEZ Capital
100
100
BEIJING
Qinhuan
gdao
2030400
0
50600 Kilometers
Beijing
dong
Pe
ninsula
Binh
ai
0
200
300 Miles
TIANJIN
D
alian
Tian
jin
Shan
Pe
nin
S H A
N D ONG
Qin
gdao
Li
anyu
J
IANG
SU
ANHU
I
A
ZHEJ I
A N G
JIANGXI
F UJI
A N
Fuzhou
G
O N G
Xiamen
Shan
tou
Shenzhen
XIANGGANG SAR
Xianggang
(Hong Kong)
U SAR
LIPP
INE
110
°
Longitude East of Greenwich
120
°
Figure 11-10
China' s special economic zones (SEZs).
From H. J. de Blij and P . O. Muller,
Geography: Realms,
Regions, and Concepts
, 14th Edition, 2010, p. 497. Originally rendered in color. Reprinted with
permission of John Wiley & Sons, Inc.
and other dissidents decried the greed and corruption
they saw among CCP officials and affiliates taking ad-
vantage of the new economic situation. In 1989, a huge
protest demonstration took place in Beijing' s
Tianan-
men Square
and in several other cities. Deng Xiaoping
called in the military , and the demonstrations were ruth-
lessly crushed with a significant loss of life. Whether
this incident is interpreted as a “cry for democracy” or a
“counterrevolutionary rebellion,” it is a black spot on
China' s modern history .
“REINFORCING BARS” TO REDUCE
REGIONAL IMBALANCES
While overall incomes have risen across the country , re-
gional imbalances have actually increased. Rich-poor
gaps have widened within cities, between urban and
rural areas, and among regions. Figure 11-11 shows re-
gional differences and emphasizes the fact that the east-
ern provinces have fared significantly better under the
new economic policies.


Search WWH ::

Custom Search