Geography Reference
In-Depth Information
Sea of
Japan
East
China Sea
Pacific Ocean
< to 4.9
low
5
9.9
moderate
10
19.9
South
China Sea
serious
20
29.9
Bay of
Bengal
alarming
Arabian Sea
30+
extremely alarming
Indian Ocean
0
0
500
1000 m
i
500
1000 km
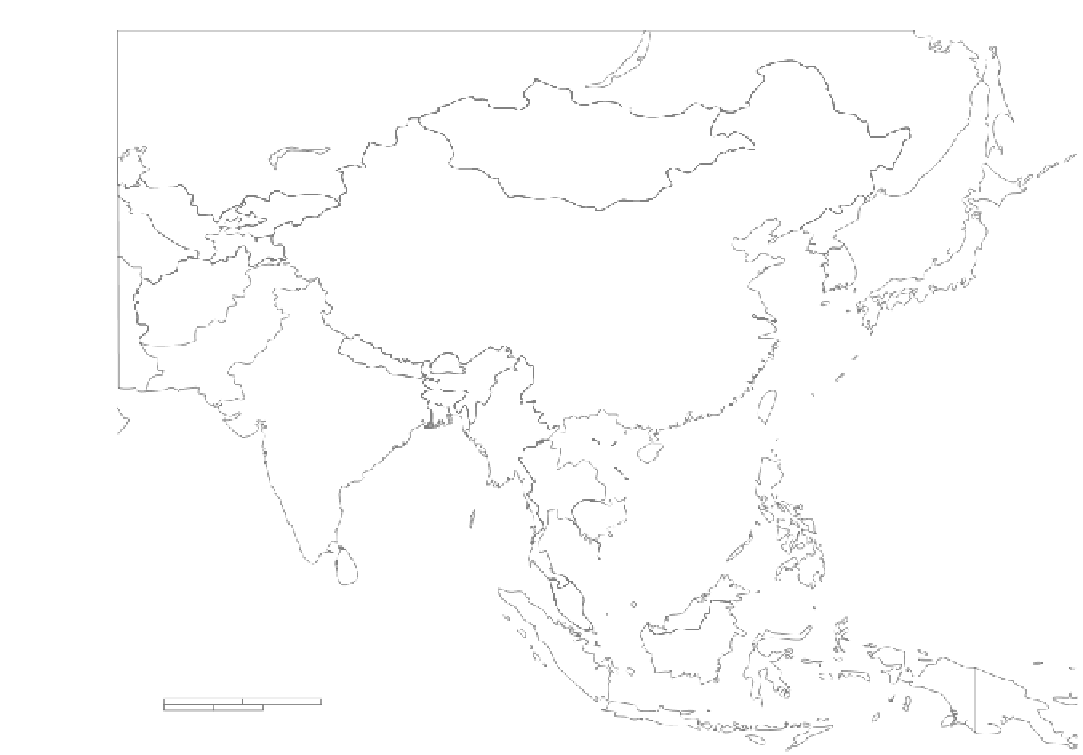
Figure 5-12
On this map you can see regional variation in the Global Hunger Index.
Source: International
Food Policy Research Institute.
unemployment is up and wages are down. People work-
ing abroad have lost their jobs and consequently , foreign
remittances have fallen. Higher food and fuel prices have
forced people to borrow money at higher interest rates,
which deepens their debt. Many of those debtors lose
their land to unscrupulous money lenders. Poor women
go without food in order to feed their families.
The world food supply is dwindling and prices are
soaring to historic levels according to the UNFAO. On
the supply side, the early effects of global warming have
decreased crop yields in some crucial places. So has a
shift away from farming for human consumption to
crops for biofuels and cattle feed. Demand for grain is in-
creasing as the world' is population grows and more is di-
verted to feed cattle as the numbers of upwardly mobile
meat-eaters increase.
The World Food Program reports that its food pro-
curement costs had gone up 50 percent from 2002 to
2007 and that poor people were being priced out of the
food market. T To make matters worse, high oil prices have
more than doubled shipping costs, putting stress on poor
nations that need to import food and the humanitarian
agencies that provide it.
WHO ARE THE HUNGRY?
We know that by and large hunger is more of a rural than
an urban phenomenon. For example, UNICEF estimates
that in East and Southeast Asia, children living in rural ar-
eas are more than twice as likely to be underweight as com-
pared with children in urban areas. This contrast is
strikingly high in Nepal, India, Sri Lanka, and Vietnam.


Search WWH ::

Custom Search