Graphics Reference
In-Depth Information
10.5.1.2 Setting up the Experiment Under KEEL Software
To do this experiment in KEEL, first of all we click on the Experiment option in
the main menu of the KEEL software tool, define the experiment as a Classification
problem and use a 10-FCV procedure to analyze the results. Next, the first step of
the experiment graph setup is to choose the data sets to be used in Table
10.3
.The
partitions in KEEL are static, meaning that further experiments carried out will stop
being dependent on particular data partitions.
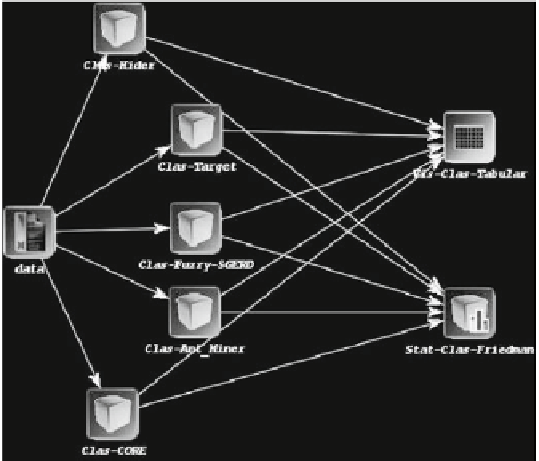
The graph in Fig.
10.9
represents the flow of data and results from the algorithms
and statistical techniques. A node can represent an initial data flow (group of data
sets), a pre-process/post-process algorithm, a learning method, test or a visualization
of results module. They can be distinguished easily by the color of the node. All
their parameters can be adjusted by clicking twice on the node. Notice that KEEL
incorporates the option of configuring the number of runs for each probabilistic
algorithm, including this option in the configuration dialog of each node (3 in this
case study). Table
10.4
shows the parameter's values selected for the algorithms
employed in this experiment (they have been taken from their respective papers
following the indications given by the authors).
The methods present in the graph are connected by directed edges, which rep-
resent a relationship between them (data or results interchange). When the data is
interchanged, the flow includes pairs of train-test data sets. Thus, the graph in this
specific example describes a flow of data from the 24 data sets to the nodes of the
Fig. 10.9
Graphical representation of the experiment in KEEL